
 | |
| Volume 14, Number 19 | December 31, 2024 |
This is the fourth issue of The Biblical Chronologist devoted to the topic of climate change. The first issue introduced a new theory called the Noahic Events theory of climate change.[1] According to this new theory, presently observed global warming is a predictable late effect of Noah's Flood, not an effect of carbon dioxide emissions. The second issue corrected prevalent mistaken climate change forecasts which stem from the mistaken, anthropogenic fossil fuel emissions theory of climate change.[2] The third issue highlighted a duplicated pattern of four oxygen isotope peaks in Greenland ice cores to falsify the Milankovitch/carbon-emissions theory of climate change and to corroborate the Noahic Events theory of climate change.[3] The purpose of this fourth issue is to provide further corroborating evidence that the Noahic Events theory is the correct scientific theory of climate change.
The Noahic Events theory of climate change can be put to the test fairly easily by looking for and counting the number of Noahic Events recorded by polar glaciers.
As previously explained, Noahic Events produce unique antipodal hotspot pairs over the surface of the globe.[4] One of the two hotspots for each pair is the volcano which triggers the Noahic Event. The other hotspot, on the opposite side of the earth, results from the consequent collision of Earth's displaced inner core with the underside of the mantle.
These hotspot pairs have activated repeatedly in the past. According to the Noahic Events theory of climate change, each trigger volcano activates independently of the others, each with its own individual period, but all having periods of roughly 100,000 years.
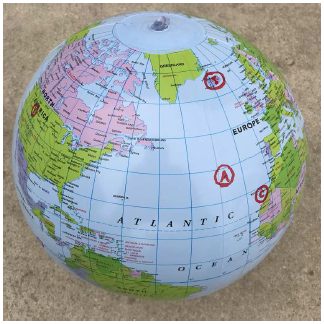
Jonathan Hagstrum has compiled a list of antipodal hotspot pairs (Figure 1).[5] His list, from what appears to be a reasonably exhaustive search over all of Earth's known hotspots, contains 14 antipodal pairs. Thus it appears that Earth has roughly 14 independent Noahic Event trigger volcanoes. I say "roughly" because it is possible that some hotspot pairs may not yet have been discovered, and it is also possible, on the flip side, that some entries in Hagstrum's list may be coincidently antipodal, having nothing to do with Noahic Events.
 |
Within a given roughly 100,000 year interval, all trigger volcanos are expected to erupt once. Thus, there should be roughly 14 Noahic Events within such an interval.
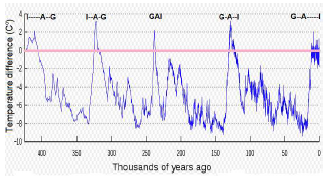
According to the Noahic Events theory of climate change, the previous four deglaciation peaks (we are presently in the fifth such peak) were due to four instances of the same three near-synchronous Noahic Events (Figure 2). These three collectively acted in each instance to denude much of the land in northern polar regions of glacier ice—as it is found to be today—resulting in pronounced global warming (Figure 3). These three count as three of the roughly 14 Noahic Events expected per roughly 100,000 years.
 |
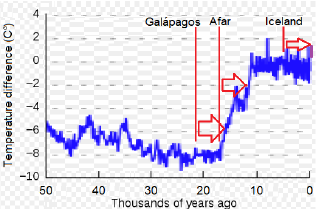 |
Figure 3 illustrates that the rapid global warmings associated with Noahic Events act as indicators of Noahic Events within glacier ice core temperature records. If the Noahic Events theory of climate change is correct, then roughly 11 additional Noahic Events should have occurred between any two of these triplet-Noahic-Event-induced warming cycles. Do ice cores reveal a total of roughly 14 Noahic Events per glacial cycle? This is the test of the theory presented this issue.
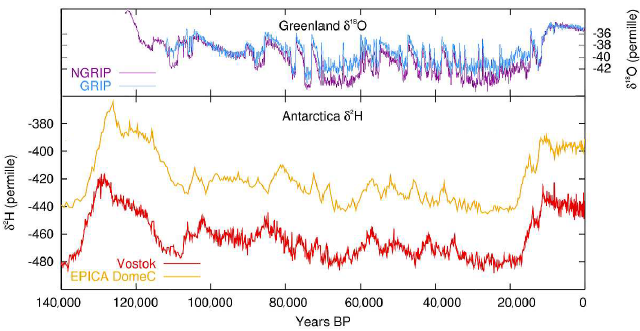
Figure 2 shows that ice cores from Antarctica clearly reveal four previous cycles of pronounced global warming (resulting from hemispherical flooding in each of the triplet Galápagos–Afar–Iceland Noahic Events, with subsequent large-scale deglaciation) followed by long intervals of overall cooling (as a result of renewed glaciation). To accomplish the present goal of counting Noahic Events between two deglaciations, ice cores from the Antarctic must be augmented with additional ice cores from the Arctic (Figure 4).
 |
Ice cores from Greenland offer the significant advantage, in the present case, of greater detail in their temperature difference records. This results from the fact that Greenland receives much more snow per year on average than does Antarctica. While Vostok, Antarctica receives less than an inch of precipitation per year on average, Greenland sites typically receive a yard or more.
This large difference has two impacts on detail.
First, it results in there being much more ice per year in a Greenland core than there is in an Antarctic core. This allows measurements to be made on samples spanning smaller intervals of time for Greenland cores, yielding greater detail.
Second, mixing together of snow from multiple years, by winds blowing snow around on the surface of the glacier, will obviously be much more of a problem for thin annual snow layers than it will be for thick annual layers.
These two factors conspire to average out details in the Antarctic ice core records compared to the Greenland ice core records.
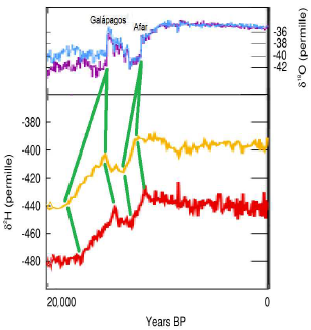
The heavy green lines in Figure 5 highlight the contrast in apparent rapidity of the global warming temperature rises due to the Galápagos and Afar Noahic Events. In the Greenland ice cores, these temperature rises appear as more or less vertical lines. In the Antarctic ice cores, they appear as long, sloped lines. Because the atmosphere mixes very rapidly compared to the timescale of this graph, global warming should have been as rapid in the southern hemisphere as it is revealed by the Greenland ice cores to have been in the northern hemisphere. Thus the Antarctic ice cores are seen to present an averaged (or smoothed) version of the global temperature change record. To see high frequency details, one must use the Greenland ice cores.
 |
While Greenland ice cores are much better than the Antarctic ice cores at preserving details of climate change, they do not reach back nearly as far in time. Ice cores from Antarctica can reach back well before the previous four glacial cycles. In contrast, Greenland ice cores are limited to just the most recent glacial cycle.
Preservation of detail is essential to the present test. We need to count only those warming peaks which are due to Noahic Events. Preservation of detail enables warming peaks due to Noahic Events to be distinguished from warming peaks due to other causes. Thus, use of the Greenland ice cores is essential to the present purpose, and this necessarily restricts the present test to just the most recent glacial cycle.
Warming peaks due to Noahic Events have a distinctive shape. They rise very rapidly, and they fall relatively slowly. Examples of two warming peaks, due to the Galápagos and Afar Noahic Events, are provided by the Greenland ice cores in Figure 5. These show the characteristic rapid rise in temperature very clearly. As a physicist, I find it impossible to fashion any cogent explanation of these rapid temperature rises when working within the carbon-emissions theory of climate change. In this, I do not appear to be alone. In the scientific literature, these warming peaks (all of them, regardless of shape) are called Dansgaard-Oeschger (D-O) events. Here is from Wikipedia.org:[6]
The processes behind the timing and amplitude of these [D-O] events (as recorded in ice cores) are still unclear.
Within the Noahic Events theory of climate change, the situation in regard to these D-O events is quite different. The explanation of the warming peaks due to Noahic Events is immediately apparent. Here is how they come about.
Recall that, within the Noahic Events theory, these rapid temperature rises happen roughly 5,500 years following the Noahic Event which is responsible for them. The Noahic Event itself results in no prompt alteration of Earth's average global temperature. This is because Earth's global temperature is determined by its total reflectivity, and Noahic Events do nothing immediately to change Earth's total reflectivity. Noahic Events immediately thin glaciers, but this doesn't make much difference to their reflectivity. What it does immediately do is destroy thinned glaciers' previous mass-flow balance, halting their growth.
The original glacier, before the Noahic Event, may be thought of as if it were a living organism, feeding on snowfalls, slowly increasing in mass and size, spreading outward, its growing extremities pushing forward year by year, smothering the land as it goes.
In this analogy, a Noahic Event kills the glacier. The glacier still exists after being flooded and thinned by the Noahic Event, but it is dead and no longer moving. Its carcass begins slowly to rot away. It continues to thin by ablation year by year. This continued thinning is a slow process, and glaciers are generally quite thick, so it takes thousands of years. But through all these years of thinning, it still remains highly reflective.
Eventually, after thousands of years, only a relatively thin skin of ice remains. The loss of this final skin can be very sudden. The smothered land begins to reappear as the final skin begins to vanish, causing Earth's total reflectivity to begin to decline. Solar radiation had previously been reflected back out into space by the residual skin of ice, but now it is absorbed by the reappearing land, heating the air above it. As a result, Earth's average annual temperature rises rapidly.
This final stage can be surprisingly rapid because it involves a positive feedback loop: melting ice begins to uncover land, which absorbs solar radiation, which raises the temperature, which melts residual ice even more quickly, which exposes more land even more quickly, …
But for polar glaciers, the carcass never completely disappears. The heart remains, and around this heart, new flesh and bone eventually begin to form. The melted-back glacier has come back to life once again. But there is nothing rapid about its regrowth. It is fed by annual snowfalls which individually are but a tiny fraction of its potential mass. While the final reduction to zero of most of its once immense carcass was sudden, evidently accomplished in some instances in a mere decade or two, its regrowth is ponderous, measured once again in thousands of years.
For a lone Noahic Event, sufficiently isolated in time from other Noahic Events, the consequent warming peak will have a sawtooth shape—a rapidly rising leading edge, due to rapid final vanishing of ice, followed by a slowly falling sloped tail, due to slow regrowth of the glacier. The Galápagos warming peak in Figure 5 shows this shape.
For Noahic Events which are close enough together in time, the eventual tail may become quite complex, but the rapidly rising edges are expected generally to be preserved for each Noahic Event involved. This results from the fact that each Noahic Event happens centered on its own antipodal hotspots pair and thus floods different parts of the globe and different glaciers. The Afar warming peak which follows on the heels of the Galápagos warming peak (Figure 5) illustrates this.
It seems that most, if not all, Noahic Events, regardless of the geographical location of their antipodal hotspots pair, should produce a warming peak in the polar ice cores. The geographical extent of flooding is nearly hemispherical, so the probability of thinning some glaciers somewhere on the globe is high. Thinning of Antarctic glaciers by flooding works as well as thinning of Arctic glaciers by flooding, and similarly for the geographically scattered alpine glaciers. All that matters is Earth's total reflectivity, and this is sensitive to recession of glaciers wherever they may be located.
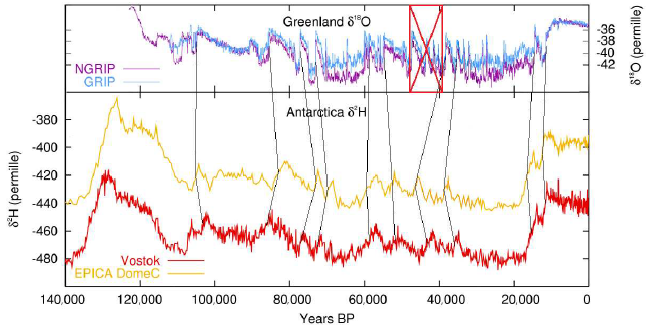
To carry out the present test, suitably shaped warming peaks were first identified in the Greenland ice cores, then corroboration of these peaks by suitable warming peaks in the Antarctica cores was sought.
Eight previously unidentified Noahic Events were found in this way (Figure 6). Counting the two Noahic Events visible on the current deglaciation peak (i.e., Galápagos and Afar) plus the Iceland Noahic Event warming peak currently underway (not visible in the graph because the graph extends only to 1950 A.D.) gives a total of 11 Noahic Events.
 |
Other warming peaks are visible in the Greenland ice cores. Most of these other warming peaks simply do not have the right shape to be counted as Noahic Event warming peaks. Figure 7 shows some examples. Peaks 1 and 2 in this figure are clearly due to Noahic Events, while peaks 3 and 4 are clearly not due to Noahic Events.
 |
The simplest hypothesis (untested) for peaks 3 and 4 within the Noahic Events theory of climate change is that they are due to episodes of increased solar irradiance. An alternate hypothesis (also untested) might be temporary darkening of large expanses of desert sand by a veneer of volcanic ash.
There are a number of reasons why the number of Noahic Events observed in ice cores might not be exactly the same as the number of antipodal hotspots pairs listed by Hagstrum. These include:
As already mentioned, Hagstrum's list may contain one or more antipodal hotspots which are merely coincidental.
Also already mentioned, Hagstrum's list may have missed some antipodal hotspots. The Tristan hotspot in Hagstrum's list, whose geomorphology is characteristic of inner-core-collision-with-the-mantel hotspots, lacks a known trigger volcano antipodal hotspot, presumably because it is hidden beneath the waters of the Pacific Ocean. This is the only entry in Hagstrum's list not having a known antipodal hotspot. It serves to illustrate that there may be yet undiscovered Noahic Event antipodal pairs. But, on the flip side, it also serves to illustrate the previous point, that some members of the list may possibly not be due to Noahic Events.
Ice core records may be missing Noahic Events due to missing ice (or missing time) as a result of meltback and/or ablation.
Ice cores may not record some Noahic Events in the case of geographically close antipodal pairs. For example, the Azores and Canary list entries are located relatively close together. If they were to trigger close enough together in time, only one Noahic Event might be recorded by the ice because they will thin much the same glaciers. The Marion and Crozet entries provide a second example of this same potential problem.
Ice cores may not record Noahic Events which happen near the top of deglaciation peaks. During these times, the amount of glacier ice remaining on the planet is at a minimum. This increases the probability that a Noahic Event might happen whose flooding fails to reach any extant glacier.
The present test has tallied 14 Noahic Events using Hagstrum's list of antipodal hotspots and 11 Noahic Events from counting Noahic Event warming peaks in ice cores. Thus, these two independent ways of counting Noahic Events are found to be in essential agreement, corroborating the Noahic Events theory of climate change. ◇
The Biblical Chronologist is written and edited by Gerald E. Aardsma, a Ph.D. scientist (nuclear physics) with special background in radioisotopic dating methods such as radiocarbon. The Biblical Chronologist has a fourfold purpose:
The Biblical Chronologist (ISSN 1081-762X) is published by: Aardsma Research & Publishing Copyright © 2024 by Aardsma Research & Publishing. |
^ Gerald E. Aardsma, "Bible/Science Corrects Mistaken Climate Change Science," The Biblical Chronologist 14.5 (March 21, 2024): 1–22. www.BiblicalChronologist.org.
^ Gerald E. Aardsma, "Bible/Science Corrects Mistaken Climate Change Science Forecasts," The Biblical Chronologist 14.16 (October 31, 2024): 1–8. www.BiblicalChronologist.org.
^ Gerald E. Aardsma, "Greenland Ice Cores Destroy the Milankovitch/Carbon-Emissions Theory of Climate Change and Corroborate the Noahic Events Theory of Climate Change," The Biblical Chronologist 14.18 (December 25, 2024): 1–6. www.BiblicalChronologist.org.
^ Gerald E. Aardsma, Noah's Flood Happened 3520 B.C. (Loda, IL: Aardsma Research and Publishing, 2015). www.BiblicalChronologist.org.
^ Jonathan T. Hagstrum, "Antipodal hotspots and bipolar catastrophes: Were oceanic large-body impacts the cause?" Earth and Planetary Science Letters 236 (2005): 13–27.
^ en.wikipedia.org/wiki/Dansgaard–Oeschger_event (accessed November 26, 2017).