
| |
| Volume 14, Number 18 | December 25, 2024 |
History never repeats itself. Man always does.
– Voltaire
In 1610, Galileo pointed a telescope—newly invented—at Jupiter and became the first human to observe its four largest moons. This single observation destroyed the strict geocentric cosmology of his day.
Strict geocentricity held Earth to be the center of the universe around which all heavenly bodies revolved. It was a theory of ancient origin. It seemed obviously true based on naked-eye observations of the heavens. It offered satisfying theological implications, showcasing the perfection of God's creation and the importance of mankind within it.
Geocentricity was deeply rooted within the society of Galileo's day, making his observations of moons orbiting Jupiter nothing less than startling.
I see the Milankovitch/carbon-emissions theory of climate change—the theory of climate change presently driving public climate-change policy around the globe—as the current generation's strict geocentricity. This theory holds natural, cyclic variations in Earth's orbit about the sun to be the fundamental driver of climate change, the small effect of these variations being amplified via a complex feedback loop, of which the atmospheric greenhouse gas, carbon dioxide, is held to be a major player. It holds modern anthropogenic carbon dioxide emissions to be the cause of current global warming. It banishes religion from its postulates but preserves a central role for mankind, as both devil, via anthropogenic emissions, and savior, via the Intergovernmental Panel on Climate Change. This theory is presently motivating the expenditure of billions of dollars annually to mitigate global warming. Because this theory is mistaken, these expenditures are actually doing more harm than good.
The purpose of the present article is to "point a telescope" at a startling curiosity in Greenland ice cores. This curiosity does to Milankovitch/carbon-emissions theory what Jupiter's moons did to geocentricity. The curiosity is a duplicated pattern of four oxygen-isotope-fractionation peaks within the Greenland ice sheet (Figure 1).
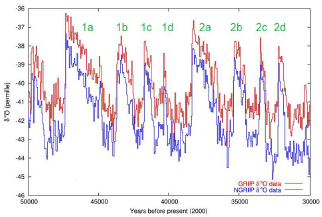 |
Just as astronomical observations are foundational to modern cosmology, so isotope-fractionation peaks in ice cores are foundational to modern climate change theory.
Variations in isotope fractionation in ice are due to variations in atmospheric temperature. Thus, ice sheets may be thought of as recorders of air temperature, and these peaks may be thought of simply as peaks in recorded air temperature.
This duplicated pattern within these ice core temperature records is inexplicable within the Milankovitch/carbon-emissions theory of climate change. How can air temperatures in any location repeat such a dynamic pattern with such near exactitude from one stretch exceeding 8,000 years to the next, while never previously nor afterward showing any hint of such a pattern over the entire roughly 120,000 years assigned to these cores?
When I say "inexplicable," I mean it in a scientific sense. Karl Popper, philosopher of science, pointed out that there are always ways to avoid the implications of data which don't fit our favored paradigm. He pointed out that even the theory of gravity can be dismissed by the simple hypothesis that the true law of motion for material bodies is randomness, and that all our observations of material bodies just happen, by chance, to give the false impression of obedience to the law of gravity. In science, Popper said, we agree to the methodological rule that reproducible regularities are not to be credited to chance.
By "inexplicable," I mean "lacking a cogent cause-and-effect explanation." I am saying that, working within the Milankovitch/carbon-emissions theory of climate change, no cogent cause-and-effect explanation can be found for the duplicated pattern of these four temperature peaks.
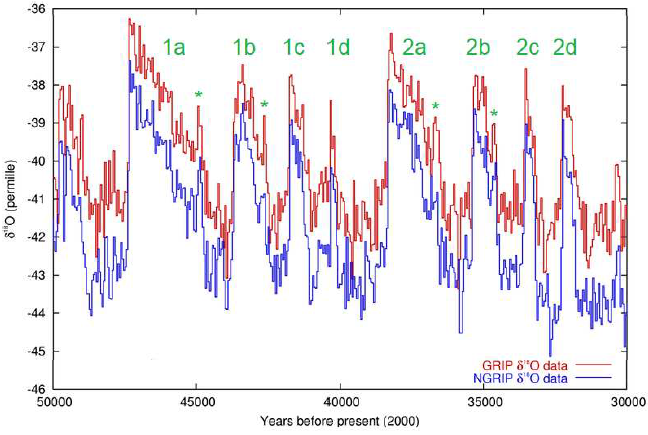
To make the meaning of "near exactitude" more precise, compare the blue curve to the red in Figure 2. These two curves are vertically offset from each other because their respective ice cores are taken from different spots on the Greenland ice sheet at different elevations; recall that temperature decreases with height in the atmosphere. Notice that while these two curves are never exactly the same at any point in time, their ups and downs are nonetheless strikingly similar. In fact, they are so similar that it is impossible to deny that they are both showing the same basic thing. They are both showing air temperatures over Greenland, and as the two are located only about 100 miles apart, the air temperatures in both locations may be expected to be not identical but too strikingly similar to deny they share a common cause. That is what I mean by "near exactitude."
 |
Temperature is an important weather parameter. This duplicated pattern of four warming peaks is all about weather.
If it is true that "history never repeats itself," as Voltaire has observed, then how did this parameter of the weather—the weather, of all things—manage to repeat this pattern in such near exactitude? And not just for a day or a week, but for more than 8,000 years? As I see it, such a feat is simply impossible. The weather is incapable of getting air temperatures to do this.
The repeated pattern of peaks in Figure 2 is clear even at a casual glance. A long, sloping, sawtooth-shaped peak (1a, 2a) is followed by three thinner peaks (1b–1c–1d, 2b–2c–2d) in each instance. The size and the shape and the spacing of the peaks are closely matched in both instances of the pattern. The biggest difference is that 1d is thinner and shorter than 2d. The reason for this difference will be made clear below.
Look closely at peak 1b. It has a shoulder peak. Look at peak 2b. It has a similar shoulder peak.
Now look at peak 1c. It does not have a shoulder peak. Look at peak 2c. It also does not have a shoulder peak.
Look at peak 1a. It has a shoulder peak down near the end of its slope. Look at peak 2a. It also has a shoulder peak down near the end of its slope.
There are other instances of sawtooth peaks and other instances of non-sawtooth peaks in the Greenland ice-sheet record (Figure 3). These other instances appear, visually, to be randomly distributed in time. No pattern other than this duplicated four-peak pattern near 40,000 years BP appears. The sawtooth peaks appear to be randomly distributed, and the non-sawtooth peaks appear to be randomly distributed, and the mix of sawtooth and non-sawtooth peaks appears to be random.
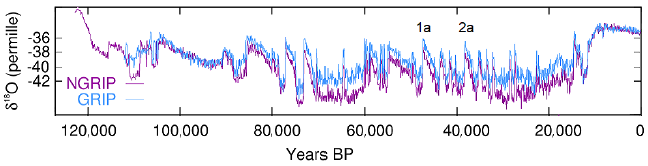 |
In stark contrast, the repetition of these four peaks near 40,000 years BP is nearly exact.
I repeat, this duplicated pattern of peaks is a startling curiosity, and this startling curiosity is inexplicable within the Milankovitch/carbon-emissions theory of climate change. According to that theory, these ice cores simply record air temperatures at their two locations on the Greenland ice sheet, and this greater-than-8,000-year pattern of complex temperature changes happened to repeat itself immediately and almost exactly, even though there is no hint of any such pattern elsewhere in this entire 120,000-year temperature record. I repeat, weather is simply incapable of doing such a thing.
That this duplicated four-peak pattern is inexplicable within the Milankovitch/carbon-emissions theory of climate change does not mean that it is intrinsically inexplicable, of course, any more than the fact of moons orbiting Jupiter is intrinsically inexplicable. The fact that there are moons orbiting Jupiter was only inexplicable within the strict geocentric cosmology of the day, which required that Earth be the center of motion for all celestial bodies. Moons orbiting Jupiter showed that this strict geocentricity was a mistaken theory of cosmology, paving the way for a different cosmology. This duplicated pattern in the Greenland ice sheet shows that the Milankovitch/carbon-emissions theory of climate change is mistaken, paving the way for a different theory of climate change. Evidently, a correct theory of climate change requires something more than just weather to explain the patterns of temperature peaks recorded in these ice sheets.
I have recently advanced a new theory of climate change.[1] I call it the Noahic Events theory of climate change. For it, this duplicated pattern is not a problem. In fact, this duplicated pattern strongly corroborates it.
Noahic Events belong to the category of natural disasters: things like earthquakes, tsunamis, tornadoes, and hurricanes. But they are far larger, far more energetic, and far more deadly than any of these more familiar natural disasters. Fortunately, they are also far less frequent. They were discovered as a recurring type of natural disaster only a decade ago.[2]
The basic physics of Noahic Events is clear. They result from Earth's solid inner core being displaced from its normal central position, by eruption of a trigger volcano, ultimately to collide with the underside of the mantle. The motion of the inner core through outer core fluid is driven by the energy released by gravitational collapse as Earth contracts radially due to loss of the inner core "foundation stone" from center. The displaced inner core, halted by collision with the mantle, produces a large gravitational anomaly at the surface of the earth above it. Things not rigidly attached to the surface of the earth, like air and oceans, move toward this mass-attractive gravitational anomaly. One consequence is hemispherical flooding centered above the displaced inner core.
Noah's Flood is the most recent instance of a Noahic Event. It happened 3520 B.C. In its case, the inner core impacted the mantle beneath Iceland. This is why Iceland is so volcanically active today.
Noah recorded what he witnessed during that event. The record can be found in the biblical book of Genesis. From it we know that the inner core took forty days to travel from center to collision with the mantle. It remained there for 150 days, during which time the resultant hemispherical flooding—Noah's Flood—persisted at full depth.
Noahic Events are the root cause of climate variability. Without them, Earth would be largely if not completely covered by glaciers. Noahic Events flood glaciers, melting them in the process, and this causes eventual warming.
Present global warming is a predictably delayed result of Noah's Flood. Earth's northern glaciers were thinned by Noah's Flood five and a half thousand years ago. Thinning disrupts the mass-balance-flow of glaciers. Their growth is halted, and ablation slowly continues thinning them until thousands of years later land reappears where glacier ice had been. The resulting increase in absorption of solar radiation is the cause of global warming.
Milankovitch cycles are ignorable; likewise carbon dioxide emissions. The Milankovitch/carbon-emissions theory of climate change has cause and effect inverted. The glaciers are not receding because of global warming. Global warming is happening because the glaciers are receding.
Noahic Event flooding is the explanation of the repeated pattern of peaks in the Greenland ice cores.
To see this, first notice that temperature peaks in ice cores may be regarded as marking individual layers of ice. Rotate Figure 3 counterclockwise from horizontal to vertical. This puts it in the same orientation as an ice core being drilled from the ice sheet. Individual snow layers are then horizontal. Thus, the temperature peaks may now be associated with different snow layers, making them to be stratigraphic markers. When looked at this way, the duplicated four-peak pattern becomes a duplicated stratigraphic pattern.
Duplicated stratigraphic patterns are familiar to geologists. They call such patterns "overthrust faults." Overthrust faults happen when one slab of crust gets pushed on top of a neighboring slab of crust. The slabs, having originated at the same time and in nearly the same place, exhibit nearly identical stratigraphy. When one slab gets pushed on top of the other slab, the stratigraphy repeats itself.
This duplicated pattern in Greenland ice is similarly due to one slab winding up on top of a neighboring slab, but this time the slabs are made of ice rather than of rock, and this time the superposition is caused by drifting, not by thrusting. The upper slab, while floating in ocean water, drifted over the lower slab. In conformity with the historical precedent set by the geologists, it seems we need to call this repeated stratigraphic sequence in the Greenland ice sheet an "overdrift fault."
Newton's theory of gravity allows the depth of water around the globe during a Noahic Event to be calculated.[3] Flooding over Iceland was 8,800 meters (five and a half miles) above mean sea level today during Noah's Flood. Flooding over central Greenland, where GRIP and NGRIP are located, would have put its modern surface about 5,000 meters under water. This yields ocean water deep enough not only to submerge the Greenland ice sheet but also to float a second ice sheet over top of the Greenland ice sheet. It makes it possible that, while the Greenland ice sheet remained frozen to its bed and thus submerged, an ice sheet covering Barents Sea, for example, was floated free of its bed and drifted over Greenland, becoming stranded there as the Flood waters receded.
Figure 4 shows how the duplicated four-peak pattern came about. In this figure, each frame shows a narrow cross section of ice through the ice sheets involved. It may help to think of them as ice cores. The date of Noah's Flood, 3520 B.C., is always at the top of all of these ice cores. I have shortened the ice cores—I have effectively shaved off the most recent 5,500 years of ice from the modern Figure 3 temperature record—back to this date, when these things happened and this overdrift fault was produced. Don't get confused. Notice that the overdrift fault, though it appears in 40,000 year-old ice, did not happen 40,000 years ago. It happened only 5,500 years ago, due to Noah's Flood. Before Noah's Flood (frame A), there was no duplicated pattern. There was just a single instance of the four peaks. The pattern got duplicated only because Noah's Flood put two ice sheets on top of each other (frames B–D). The duplicated pattern is present only following the Flood (frame E).
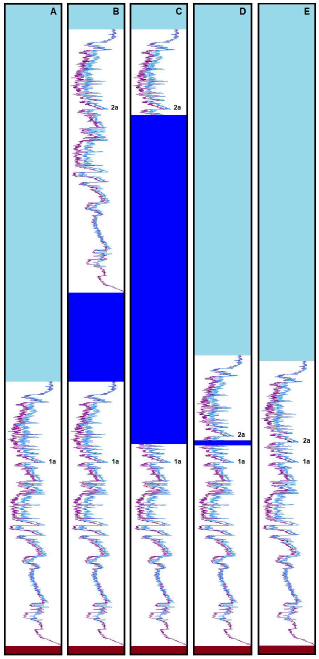 |
The contact between the lower and upper ice slabs—the overdrift fault—is located part way through peak 1d, which is why it is thinner than peak 2d.
This sort of event can only happen once per glacial cycle. This is because: 1) Noahic Events happen at known locations on the globe, and Iceland is the only Noahic Event location close enough to Greenland to produce deep enough water over Greenland to lift an ice sheet from elsewhere above the Greenland ice sheet, and 2) individual Noahic Events trigger only once per glacial cycle. (This periodicity of Noahic Events is, in fact, the cause of the observed glacial cycles.) Because Greenland ice cores record only the most recent glacial cycle, only one repeated pattern is possible. Of course, a repeated pattern is not mandatory each glacial cycle. If the ice sheet from elsewhere had drifted away from Greenland during the Flood, no duplication would have occurred.
Geocentrism did not topple immediately, of course. They said the telescope worked when pointed at things on the earth, but that it deceived when pointed at things in the heavens. They accused Galileo of stupidity. They accused him of arrogance. They accused him of lying. They accused him of impiety. They censored him. They placed him under house arrest to shut him up and shut him down.
But they couldn't shut the scientific data down. Earth was either the center of motion for all celestial bodies or it wasn't. Jupiter's moons, persisting heedlessly in their recalcitrant orbits, showed that it wasn't.
The four duplicated peaks in the Greenland ice sheet play the same role that the four pin-pricks of light orbiting Jupiter that Galileo saw in his telescope played. The pattern of temperature peaks in polar ice cores is either due solely to weather or it isn't. The four duplicated peaks in the Greenland ice sheet show that it isn't.
This destroys the presently accepted chronology of the Greenland ice cores. Worse, it destroys the assumptions of uniformity and steady state underlying the ice flow models upon which the chronologies of all polar ice sheets have been built.
I examined Devon Island, Canada, ice sheet cores a decade ago.[4] Similarly mistaken chrononomy was found in that instance. That ice sheet was found to have been melted back from the top, reducing its thickness from about 190 meters to a mere 50 meters. Using layer thickness data, I worked out the correct chronology. The meltback event was found to have been synchronous with Noah's Flood.
Treating Noah's Flood as a real historical event offends the secular sentiment of the present generation just as heliocentrism—the idea that Earth orbits the sun—offended the religious sentiment of Galileo's generation. Today's secularism will ultimately come to be seen as an over-correction of the domineering religious sentiment of Galileo's day. Secularism has now itself become domineering, stifling the truth every bit as badly as the religious sentiment of Galileo's day and with equally blind bigotry.
History never repeats itself. Man always does. ◇
The Biblical Chronologist is written and edited by Gerald E. Aardsma, a Ph.D. scientist (nuclear physics) with special background in radioisotopic dating methods such as radiocarbon. The Biblical Chronologist has a fourfold purpose:
The Biblical Chronologist (ISSN 1081-762X) is published by: Aardsma Research & Publishing Copyright © 2024 by Aardsma Research & Publishing. |
^ Gerald E. Aardsma, "Bible/Science Corrects Mistaken Climate Change Science," The Biblical Chronologist 14.5 (March 21, 2024): 1–22. www.BiblicalChronologist.org.
^ Gerald E. Aardsma, Noah's Flood Happened 3520 B.C. (Loda, IL: Aardsma Research and Publishing, 2015). www.BiblicalChronologist.org.
^ Gerald E. Aardsma, Noah's Flood Happened 3520 B.C. (Loda, IL: Aardsma Research and Publishing, 2015), 225. www.BiblicalChronologist.org.
^ Gerald E. Aardsma, Noah's Flood Happened 3520 B.C. (Loda, IL: Aardsma Research and Publishing, 2015). www.BiblicalChronologist.org.