
| |
| Volume 10, Number 8 | May 13, 2020 |
This is one of those BC issues where new light dawns and, in consequence, things look different by the end of it than they had looked at the start of it. One change, in particular, needs to be highlighted here, at the outset: you will come to see the importance of the anti-aging vitamins for children in a new way.
As is common for the BC, it all begins in Genesis. I would like to say, "Buckle up and enjoy the ride," but, "Buckle up and brace for impact" may be more appropriate.
A solid background in math is a definite advantage this issue, but every effort, including multiple analogies, has been made to keep the important discovery communicated in the present article comprehensible to the average lay reader.
Last issue,[1] a survival curve for human males in modern times was highlighted. Data for U.S. males from a 2016 actuarial life table[2] were used to teach how to analyze survival curve data in light of the General Theory of Aging.[3]
This issue, a survival curve for human males in ancient times is the main item of interest. Biblical life span data for pre-Flood males are used to advance understanding of the nature of the human aging disease another step further.
A survival curve for males of ancient times can be approximated using the life spans recorded in Genesis for pre-Flood male ancestors of Noah. Table 1 shows the seven data points of interest. Enoch is excluded from this dataset because he did not die of aging.[4] Lamech is excluded because his low age at death (777 years) relative to the other pre-Flood males listed in Genesis 5 makes it seem unlikely that he died of aging.[5] In fact, it seems more probable that he perished in the Flood.[6] Methuselah, who may also have perished in the Flood, is nonetheless included in the list because his age at death, the largest in the list, implies that a misassignment error in his case would make little difference. Noah is excluded from the dataset because he lived both before and after the Flood.
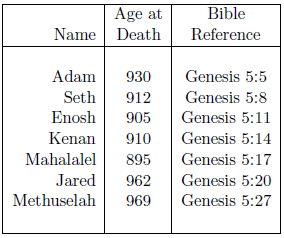 |
These data present the difficulty, for survival curve construction purposes, that the birthdates of the individuals involved were not all the same. In fact, the birthdates involved span 687 years.[7] This difficulty can be overcome by assuming that conditions were sufficiently uniform in the pre-Flood period in question not to alter life spans. This amounts to the assumption that methylphosphine gas concentrations remained constant in the pre-Flood atmosphere during the time span of interest.[8]
Unfortunately, the Table 1 data themselves are, if anything, opposed to this assumption. The two longest life spans, for Jared and Methuselah, occur at the end of the list. This suggests the possibility that atmospheric methylphosphine gas concentrations may have been slowly increasing pre-Flood. This possibility is encouraged when the pre-Flood source of methylphosphine gas, from biogenic ocean floor sediments, is considered.[9] It is clearly possible for biogenic sediments to build up with the passage of time, consequently releasing increasing amounts of decomposition gases.
Nonetheless, an approximate survival curve can be constructed from these data as long as one is prepared to accept the uncertainty in pre-Flood atmospheric methylphosphine gas concentration. In the present application, this uncertainty turns out to be of relatively minor importance.
Figure 1 shows both last issue's modern and this issue's ancient survival curve datasets with least-squares fitted curves using the Aardsma model,[10] shown in Equation 1.

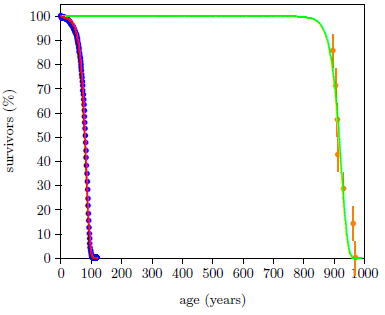 |
The graph is somewhat remarkable. It is first of all remarkable that the Aardsma model is able to fit the biblical life span dataset successfully. This ancient dataset exhibits a very much greater human longevity than the modern dataset. The phenomenon of human aging was obviously behaving in a significantly different way back then compared to now. Yet the relatively simple Aardsma model is able to describe both datasets successfully. This strengthens confidence in both the integrity of these data and the utility of the Aardsma model for analyzing survival curve datasets.
But even more remarkable is the shape of the biblical dataset, made explicit by its fitted curve. This shape is not what one would naturally expect.
In the development of the General Theory of Aging, wear of two-cycle engines was used to help illustrate what is going on with aging.[11] Two-cycle engines require oil to be mixed with the fuel to lubricate the engines' moving parts during operation. If oil is not mixed with the fuel, or if too little oil is added, the rate of wear will increase, and the engines will "die" more quickly.
Imagine, for a moment, that Figure 1 represents two-cycle weed eater machines rather than human males. Change the "age" axis scale from years to something more suitable, like minutes of operation. Then the red curve represents weed eaters run with no oil in the fuel, and the green curve represents weed eaters run with some (but still not enough) oil in the fuel.
The green curve seems immediately wrong. One does expect weed eaters having some oil to live longer than weed eaters having no oil, but one does not expect weed eaters having some lubrication to die off in a tight time band similar to the tightly grouped die-off time band for unlubricated weed eaters. One naturally expects lubrication both to lengthen the average life span and to spread out the time between deaths. We expect this because lubrication slows wear, and, after the first machine has died due to wear, it is additional wear which causes the death of the second machine. Since wear has been slowed down, the spacing between deaths should spread out.
The magenta curve in Figure 2 shows what might naturally be expected for lubricated weed eaters. This is what one would naturally expect if wear had been reduced by a factor of 10. It is simply the red curve stetched along the time axis by a factor of 10.
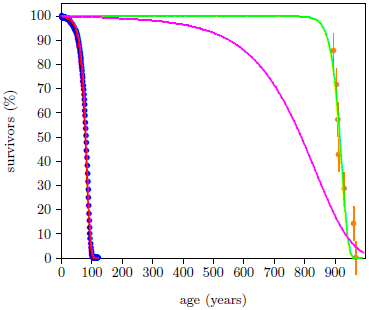 |
The ancient survival curve data are clearly not in harmony with this natural expectation. The green curve is significantly different from the magenta curve. The spacing between deaths for the red and the green curves in Figure 2 seems too similar for the large increase in average life span exhibited by the green curve.
These Genesis survival curve data are telling us something important about the nature of the aging process in humans. They are saying that aging pre-Flood was not simply modern aging stretched out over a longer time. Rather, pre-Flood aging seems to have been more like modern aging delayed by about 850 years.
Automobiles provide a useful mechanical example at this point, illustrating how survival curves shaped like the green curve may come about.
Imagine a cohort of 100 identical automobiles, fresh from the factory. As is normal for automobiles, they have an electrical system. Principal components of the electrical system are an alternator to generate electric current, a battery to store and supply electric current, a belt and pulley arrangement for turning the alternator armature, and wires delivering electric current to electrical devices.
Fresh from the factory, the automobiles are functioning normally, but the electrical systems are already aging. Of specific interest in the present context, the alternator belts suffer a tiny amount of wear with each revolution of their respective armatures. The automobiles are suffering alternator-belt-wear disease.
After many hours of constant operation, the alternator belts finally wear out and break, all pretty much at the same time. With the alternator armatures no longer turning, no electric currents are being generated, but the batteries keep supplying electric current, so the automobiles continue to run. Unfortunately, this results in a new pathology: drained-battery disease.
Drained-battery disease progresses at different rates for the individual automobiles, depending on the use of the various electrical devices such as radios, fans, interior lights, signal lights, headlights, etc. Symptoms of progression of the disease include slowly dimming headlights, slowing of turn signal blink rates, eventual stalling of the engines, and only clicking sounds when ignition keys are turned to restart the engines. Eventually, drained-battery disease runs its course, ending with the "deaths" of all of the automobiles.
Take-home points from this analogy are:
The automobiles ran just fine initially, despite the progression of alternator-belt-wear disease.
Alternator-belt-wear disease induced drained-battery disease.
The automobiles did not die of alternator-belt-wear disease. They died of drained-battery disease.
The two diseases are separate. Each disease progresses on its own independent time schedule.
Now consider what the least-squares fit curves of the Aardsma model have to say about the modern and ancient datasets.
Table 2 shows the fitted parameters from the Aardsma model for the two cases shown in Figure 1. The parameter R, which describes random deaths, is not of much interest in the present context. Notice merely that, for the ancient dataset, its uncertainty is much larger than its value, which is just another way of saying that it is effectively zero. This is as it should be. As the survival curve constructed from these ancient biblical life spans contains only long-lived males, it contains no experimental information about random deaths.
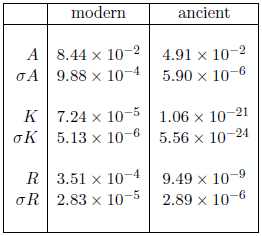 |
It is the other two parameters, A and K, which are of real interest. These two parameters control the exponential progression of the aging disease. Notice that while A is of the same order of magnitude (i.e., 10-2) for both modern and ancient datasets, K is 16 orders of magnitude smaller for the ancient dataset than it is for the modern dataset. The ratio of modern to ancient for A is 1.7, while for K it is 6.8×10¹⁶. Thus, the relative change in A is small, while the relative change in K is huge.
This suggests the possibility that A may be intrinsic to the organism, and K extrinsic. The organism is the same in both datasets—human males—and A is nearly the same for both datasets. Environmental availability of MePiA—a factor extrinsic to the organism—has changed hugely between the two datasets (from nearly enough to zero), and K has changed hugely.
A little trial and error supports this possibility. It reveals that an acceptable fit to both datasets can be obtained by deliberately keeping A identically the same for both datasets and allowing only K to vary. Using the modern value for A of 8.44×10⁻² as a fixed (rather than free) parameter of the model with the ancient dataset yields a visually and statistically (Χ2ν = 0.68) acceptable goodness of fit to the ancient dataset. In contrast, the opposite case, of using the modern value for K of 7.24×10⁻⁵ as a fixed parameter of the model with the ancient dataset yields a visually and statistically (Χ2ν = 3.4) unacceptable goodness of fit.
Similar reasoning suggests that K should be identified principally with the plateau, the feature which has changed so remarkably between the two datasets, and A with the ski slope, the feature which has changed so little. K, in fact, appears to control the length of the plateau, while A appears to control the steepness of the ski slope. Thus K seems to be all about longevity, while A seems to be all about clinical manifestation of the aging disease. These two separate parameters seem to be describing two separate phases of the aging process.
What the Aardsma model is saying, when understood in this way, is that:
Pre-Flood humans, after developing to young adult maturity in much the same way as humans do today, maintained a mature, young-adult youthfulness until a chronological age of roughly 800 years, and then they began to age and die, in much the same way as humans age today, so that nearly all were dead before another 150 years had passed.
Human aging is a two-phase disease. It has an induction phase (Phase I, the plateau), the length of which is subject to extrinsic factors, followed by an induced phase (Phase II, the ski slope), which is intrinsic to the organism.
Modern human aging is slightly different from pre-Flood human aging. Modern human aging is pre-Flood human aging plus vitamin MePA deficiency disease. Let us call vitamin MePA deficiency disease "Aging 0." Because MePA was naturally available pre-Flood, Aging 0 was not a part of pre-Flood human aging. Today, Aging 0 is present as a component of the modern human aging disease during both Phase I and Phase II. Aging 0 can be prevented and cured by adequate daily intake of vitamin MePA.
The length of the induction period (Phase I) is controlled by the amount of dietary intake of vitamin MePiA. Let us call vitamin MePiA deficiency disease "Aging 1." Aging 1 is present as a second component of the modern human aging disease during both Phase I and Phase II. The insidious presence of Aging 1 in Phase I results in the induction of Phase II. Aging 1 can be prevented and cured by adequate daily intake of vitamin MePiA.
(Now brace for impact.) The induced phase (Phase II) is not due either to Aging 0 or to Aging 1. It appears to be due to an induced mitochondrial disease. Let us call this mitochondrial disease "Aging 2." (More on Aging 2 below.) Most disturbingly, while MePiA is preventive of Aging 2, there is presently no known cure for this mitochondrial disease. This means that Aging 2 may presently be incurable once it has been induced. The start of Phase II today appears to be probably not later than 10 years of age.[12]
Two-phase human aging can be explained fairly simply by an adaptation of the MePiA mitochondrial free radical theory of aging introduced in Addendum to Aging: Cause and Cure.[13] In the MePiA mitochondrial free radical theory of aging, MePiA is the specific antioxidant needed to prevent free radical damage to mitochondria (energy-producing organelles in cells). In the present context, Phase I corresponds to free radical damage of mitochondrial DNA (mtDNA). Phase II corresponds to Aging 2, a mitochondrial disease of what I will call the mtDNA "scrapping apparatus," induced by overuse of this scrapping apparatus due to an excessive rate of damage of mtDNA by free radicals.
Phase I is lengthened by addition of vitamin MePiA to the diet. This happens, within the present theoretical framework, because of free radical scavenging by MePiA. Vitamin MePiA, like vitamin C and vitamin E, is an exogenous nutrient antioxidant. MePiA functions as an antioxidant for reactive oxygen species, including hydroxyl radical, OH·, the most reactive and potentially destructive of the free radicals.
Phase II is induced by the free radical damage accompanying Aging 1 in Phase I, but the death of the organism results from the progression of the induced mitochondrial disease, Aging 2, not from free radical damage per se.
This adaptation of the MePiA mitochondrial free radical theory of aging needs a new name, to differentiate it from previous ideas. I will call it the "two-phase theory of human aging."
Note that this theory supersedes the special theory of aging.[14]
Special Theory of Aging: Contemporary human aging is simply progression of a congenital deficiency disease of the anti-aging vitamins MePA and MePiA.This special theory, while in one sense still true, is no longer adequate. To be perfectly clear about what is now being proposed to take its place, the two-phase theory of human aging is stated succinctly below:
Two-Phase Theory of Human Aging: Contemporary human aging is a composite of the progression of three diseases:Aging 0 runs concurrent with Aging 1 and Aging 2.
Aging 0: congenital vitamin MePA deficiency disease,
Aging 1: congenital vitamin MePiA deficiency disease, and
Aging 2: a mitochondrial genetic disease induced by Aging 1.
Vitamin MePiA probably exerts its antioxidant activity throughout the body, but to prevent Aging 2, it is needed specifically in the mitochondria. MePiA prevents induction of Aging 2 by protecting mtDNA from free radical damage.
Aging 0 and Aging 1 may contribute in a minor way to aging deaths, but progression of Aging 2 is responsible for most aging deaths.
According to the two-phase theory, aging progresses in humans as if it were controlled by mechanical outlet timers (commonly used by homeowners to turn lights on and off in their homes while they are away on vacation). Each member of the survival curve cohort has his own timer. In this analogy, the timers are all set to turn their outlets on at the same preset time and then leave them on. During Phase I, the mechanical timers run, ticking off the seconds, until the preset time is reached. At that point, they all flip their switches more or less at the same time, turning the power on to the Phase II process.
The first task for the two-phase theory is to demonstrate that it can give rise to a plausible biological timed switch explaining Figure 1. The similarity of the spacing between deaths for the two curves in Figure 1 imposes two conditions which any proposed biological timer design must satisfy. For the spacing between deaths for the green curve not to be markedly increased relative to the red curve:
all members of the cohort must enter Phase II at nearly the same time regardless of the length of Phase I, and
the continuance of the Phase I process, once the Phase II process has begun, must not significantly influence the rate at which the Phase II process unfolds.
The simplest idea for a hypothetical switch design is probably that Aging 2 is switched on by a specific, free-radical induced point mutation of mtDNA. Call this specific mutation mtDNAx. Free radical attack of mtDNA results in mtDNAx, and mtDNAx expresses itself clinically as aging of the organism. Without the mutation there is no Aging 2 disease. With it there is Aging 2 disease.
This simplest switch demonstrates that the two-phase theory provides a framework within which switches are possible. Beyond this, however, this simple switch is not very functional. It has the problem, for example, that there is no obvious timer associated with it. Free radicals are being generated all the time. Why, in the pre-Flood, did this switch turn on in all members of the cohort only at age 800 years?
A timer function demands a more complex type of switch. To obtain a functional timer, it seems necessary to postulate some sort of Poisson process. A Poisson process describes the occurrence of sequential unlikely events randomly in time. Here is an example of a Poisson process resulting from the bursting of water balloons.
Imagine using an air rifle to shoot pellets at water balloons. A single, water-filled balloon is suspended from an overhead slanted rod by a string. If the balloon gets hit by a pellet, it bursts. At that point another suspended water balloon slides down the rod and takes its place. There are 9 balloons total. The target balloon is hard to hit because it is pretty far away. In fact, a hit is scored only once per 100 shots on average. The shooter keeps firing until all balloons, one after the other, are burst. A list of the number of shots it took to burst each balloon is a Poisson sequence. The significance of this will be made clear in a moment. For now, merely notice that it takes some time for all the balloons to be hit.
Now imagine that there are lots of these water balloon setups, each with equally-skilled, independent shooters who start shooting at the same time and shoot at the same constant rate. We are trying to design timers which have the property that they will all flip their switches at nearly the same time. In the present example, we want all shooters to finish bursting all the balloons at nearly the same time.
Since the probability of scoring a hit is 0.01, on average it will take (9/0.01=) 900 shots for a given shooter to burst his 9 balloons. This is the average. In practice, some shooters will get lucky and do better than average and some will get unlucky and do worse than average. Now here is the important thing, in the present context, about a Poisson process. Not only the average number of shots can be foretold but also the spread (technically, the standard deviation) in the actual number of shots around the average can be foretold. For a Poisson process, the spread is just the square root of the average. This allows us to know, for example, up front, before any shooting begins, that two-thirds of the shooters will have burst all 9 balloons within (√ 900 =) 30 shots of 900 total shots, and less than 1 shooter in 100 will take either fewer than 810 shots or more than 990 shots. Thus, this balloon-bursting timer has the property that we are looking for. All shooters will finish shooting at nearly the same time.
The timer can be improved by increasing the number of balloons. For 9 balloons the relative spread is (√ 900 /900*100=) 3.3%. For 900 balloons it is (√ 90,000 /90,000*100=) 0.33%. The relative spread can be made as small as we please by starting with a large enough number of balloons.
This example can be ported over into the two-phase theory of aging as an analogy by identifying each individual shooter with free-radical generating processes in individual cells, the pellets with free radicals, and the water balloons with mtDNA within the cell. The essential idea of the analogy then becomes irreparable damage of mtDNA due to free-radicals (this may correspond to double strand breaks, for example, and may take more than one "hit" to accomplish) necessitating scrapping of the mtDNA copy. Scrapping of the mtDNA copy, like the bursting of the balloon, is the Poisson event. Fundamental to the design of the switch is that there be a large but finite number of sequential scrap-and-replace cycles possible. The switch from Aging 1 to Aging 2, in this case, results from running out of scrap-and-replace cycles.
This analogy seems sufficiently functional to me to elevate it, at this point, to the status of a formal hypothesis of the two-phase theory of human aging. I will call it the "mtDNA scrapping hypothesis."
mtDNA Scrapping Hypothesis: Aging 2 results from inability of the cell to scrap and replace damaged copies of mtDNA indefinitely.
The idea that mtDNA can no longer be replaced may imply a limit on the number of times mtDNA can be copied, presumably beginning back at the stem cell. This suggests that there may be some sort of mechanical problem with copying mtDNA, analogous to the telomere shortening problem for nuclear DNA (nDNA).
Telomeres cap nDNA chromosomes. Replication of nDNA causes a mechanical shortening of the telomere cap. This shortening causes no loss of genetic information as the telomere carries no genetic information. But shortening of the telomere cap cannot go on indefinitely because the telomere has a finite length. Eventually, the telomere will be used up and mechanical shortening will begin to eat into the genetic information section of the chromosome. Thus body cells cannot replicate nDNA indefinitely. (Germ cells have ability to add length back on to telomeres, so the germ cell line can go on replicating indefinitely, generation after generation.)
Human mtDNA does not have telomeres. Human mtDNA is a circular molecule having no ends needing to be capped. Clearly, something other than telomere shortening is going on with mtDNA. But the important point which I am tying to make is that mtDNA may run into a scrap-and-replace dead end which is due to a mechanical limitation rather than being due to an mtDNA genetic mutation problem.
Please keep in mind that this is a hypothesis—a scientific guess. It may be wrong. Given the staggering complexity of the human body, it seems likely to wind up needing some serious fine tuning in the least case. But the point, here and now, is not to pinpoint the cause of Aging 2. The point is merely to demonstrate that it is possible to furnish plausible timed switch mechanisms within the framework furnished by the two-phase theory of aging. Beyond this, the mtDNA scrapping hypothesis serves the good purpose of furnishing an initial working hypothesis for the cause of Aging 2, facilitating experimental testing and further theoretical development relevant to this now-important disease.
An important input to timed switch design is the length of the Poisson sequence that it must furnish. In the balloon analogy, this amounts to the question of how many balloons are needed to get the shooters to finish close enough to the same time. The answer, for human aging, turns out to be a minimum of 2,200. That is, for the analogous mtDNA scrapping hypothesis, at least 2,200 sequential mtDNA scrap-and-replace cycles must be possible. This number is calculated from the ancient and modern survival curves as follows.
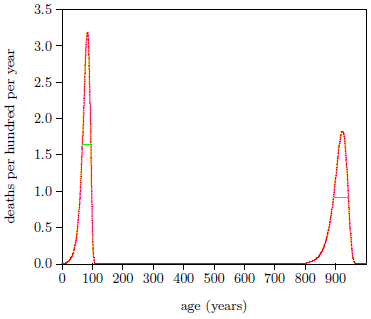
Figure 3 shows death rates versus age resulting from the modern and ancient fits. For the modern dataset, the full width at half maximum of the frequency distribution of age at death is 28 years. For the ancient dataset, it is 49 years. Let X be the maximum allowable additional spread in full width at half maximum due to the switches not all switching at the same time. Then error propagation says that 492 = 282 + X2, which gives X = 40 years.
 |
For the ancient dataset, the switch flips on after roughly 800 years. Let M represent the number of mtDNA replacements for a given mtDNA copy lineage beginning back at the stem cell during that 800-year counting interval. Poisson counting statistics says that the standard deviation in this count will be (√ M ). For large M, the Poisson distribution and the Normal distribution become approximately the same. The full width at half maximum for the Normal distribution is 2.35 times its standard deviation. This allows the standard deviation in the present case to be converted to full width at half maximum by multiplying by 2.35. So we wish to find M such that

This yields M ≥ 2,200.
A panoramic view of modern human aging in the absence of dietary MePiA and MePA can now be presented as follows using the mtDNA scrapping hypothesis variant of the two-phase human aging theory.
At conception, all is well. The human organism develops over nine months from a single cell to a newborn infant. But already Aging 0 and Aging 1 are progressing. Of these two diseases, Aging 1 is dominant.
Aging 0 may be thought of as progressing slowly in the background. Without MePA, numerous (yet unidentified) biochemical pathways are blocked and the body's cells cannot operate at peak efficiency. Nonetheless, the body is able to carry on with growth and development. A harvest of physical and mental ailments will result from this deficiency disease in the later decades of life.
Meanwhile, back at the infant, Aging 1 is progressing with disastrous speed. Without MePiA, free radicals, especially OH·, generated as a consequence of normal cellular respiration, are destructively burning tissues all through the body even as growth and development are working to build the body up. The mitochondria, being centers of oxidative respiration, are perpetually ablaze with free radicals, making mtDNA especially subject to damage. When an mtDNA copy becomes irreparably damaged, it is scrapped,[15] and a replacement copy is produced by replication of another, functioning mtDNA copy.
Unfortunately, this fire-fighting measure cannot be sustained indefinitely. By the time the child is 10, mitochondria have lost ability to scrap mtDNA as a means of damage control, and Aging 2 has begun. Damaged mtDNA must now be retained and patched up as best as can be managed.
The free-radical inferno rages unchecked, but the body now has a yet bigger problem. Aging 2 is now the dominant disease. Copies of mtDNA are accumulating errors. Precisely how this error accumulation progresses Aging 2 disease is hard to say. The difficulty is not that there are no good possibilities, but rather that there are a host of possibilities. A fascinating, recent hypothesis is that damaged mtDNA hogs nucleotides (building blocks of DNA), depriving the nucleus of the nucleotides it needs to repair nDNA.[16] In this hypothesis, aging (Aging 2 in the present context) is seen as the whole-body outworking of nDNA damage induced by mtDNA damage. This hypothesis meshes well with the mtDNA scrapping hypothesis if one pictures: (1) mtDNA scrapping as conservative of nucleotides via recycling, while (2) the fall-back repair mechanism (whatever it may be once scrapping is no longer possible) as inefficient and wasteful of nucleotides.
Ultimately, Aging 2 wins. By age 40, "aging" is visibly evident. By age 80, no shred of youthfulness remains. Generally long before age 120, the individual has died as a victim of Aging 2 disease.
Though Aging 2 is the hangman in this drama, Aging 1 is clearly the villain.
My understanding of the human aging disease has increased rapidly in the past several years. Along with this growth in new knowledge has come a normal share of unexpected twists and turns.
In 2017, when Aging: Cause and Cure was published, it appeared that Aging 0 (MePA deficiency disease) was the sole cause of human aging. It seemed all but certain that dietary supplementation with vitamin MePA alone would be sufficient to cure human aging. Abundant testimonial evidence from early users of vitamin MePA encouraged this belief. Vitamin MePA clearly demonstrated positive physical and mental health benefits, sometimes in dramatic fashion. This body of evidence still stands today.
Then, in 2019, experimental data from mice revealed that Aging 0 was not the whole story. There was also Aging 1. Aging 1 was due to deficiency of a second vitamin—vitamin MePiA—uniquely responsible for life lengthening.
This discovery was published as Addendum to Aging: Cause and Cure. Addition of this second vitamin deficiency disease to the cause and cure of modern human aging left intact the feeling of certainty that modern human aging could be reversed. All that had changed was a dietary need for two new vitamins rather than one.
The two-phase theory of human aging now overturns this certainty. Dr. Aardsma's Anti-Aging Vitamins, a dietary supplement containing both MePA and MePiA, furnishes the cure of Aging 0 and of Aging 1, and this supplement furnishes a preventative of Aging 2 to those who have not yet entered Phase II (probably less than age 10), but a cure of Aging 2, once it has been induced, is now uncertain. Fortunately, a prospect of curative efficacy of MePiA for Aging 2 yet remains.
According to our best present understanding, adequate daily intake of vitamin MePiA effectively halts further free-radical damage of mtDNA, and not only of mtDNA but probably of body tissues in general. MePiA quenches the in vivo free-radical inferno, allowing opportunity for general healing to begin.
We now know that Noah experienced healing (not just halting) of Aging 1 disease during the methylphosphine Spike which followed the Flood.[17] Working within the two-phase theory, Noah's healing tells us immediately that mtDNA damage leading to Aging 2 can be reversed by adequate daily intake of vitamin MePiA. While this is encouraging, it is not definitive for healing of Aging 2 itself. Noah had not yet entered Phase II. He was only 600 years old when the Flood began,[18] roughly 200 years shy of the pre-Flood onset of Phase II. We have no experimental human data on the question of whether Aging 2 disease can be reversed by MePiA.
The critical question seems to be whether mtDNA scrapping is broken in our stem cells or only in subsequent, differentiated cells. If the stem cells are yet able to scrap mtDNA, then there seems hope that the course of Aging 2 may slowly be reversed by natural healing, once the inferno has been quenched by vitamin MePiA.
In that event, Dr. Aardsma's Anti-Aging Vitamins will provide healing not only of Aging 0, with its multitudinous unpleasant symptoms and debilitations, and of Aging 1, with its numerous negative health implications due to free-radical damage of tissues throughout the body, but also of Aging 2, with its all-too-familiar harvest of morbidity and mortality. Let us hope and pray that this may be the case even while we labor to discover whether or not it is truly so.
Meanwhile, we know how to save the children. Let us who are caught in the clutches of Aging 2 be diligent not to let their opportunity to avoid this plight slip away. ◇
The Biblical Chronologist is written and edited by Gerald E. Aardsma, a Ph.D. scientist (nuclear physics) with special background in radioisotopic dating methods such as radiocarbon. The Biblical Chronologist has a fourfold purpose:
The Biblical Chronologist (ISSN 1081-762X) is published by: Aardsma Research & Publishing Copyright © 2020 by Aardsma Research & Publishing.
|
^ Gerald E. Aardsma, "Modeling Survival Curves in Light of the General Theory of Aging," The Biblical Chronologist 10.7 (April 24, 2020): 1–7. www.BiblicalChronologist.org.
^ ssa.gov/oact/STATS/table4c6.html (accessed March 2, 2020).
^ Gerald E. Aardsma, "A General Theory of Aging: Part I," The Biblical Chronologist 10.2 (February 12, 2020): 1–4. www.BiblicalChronologist.org. Gerald E. Aardsma, "A General Theory of Aging: Part II," The Biblical Chronologist 10.3 (March 4, 2020): 1–4. www.BiblicalChronologist.org. Gerald E. Aardsma, "A General Theory of Aging: Part III," The Biblical Chronologist 10.5 (March 31, 2020): 1–5. www.BiblicalChronologist.org.
^ Genesis 5: 23–24.
^ Genesis 5:31.
^ Gerald E. Aardsma, "Readers Write: Did Lamech Die in the Flood?," The Biblical Chronologist 7.5 (September/October 2001): 6–7. www.BiblicalChronologist.org.
^ Gerald E. Aardsma, Aging: Cause and Cure (Loda, IL: Aardsma Research and Publishing, 2017), page 31, Table 2. www.BiblicalChronologist.org.
^ Gerald E. Aardsma, Aging: Cause and Cure (Loda, IL: Aardsma Research and Publishing, 2017), pages 73–77. www.BiblicalChronologist.org.
^ Gerald E. Aardsma, Aging: Cause and Cure (Loda, IL: Aardsma Research and Publishing, 2017), pages 71–76. www.BiblicalChronologist.org.
^ Gerald E. Aardsma, "Modeling Survival Curves in Light of the General Theory of Aging," The Biblical Chronologist 10.7 (April 24, 2020): page 4, equation 7. www.BiblicalChronologist.org.
^ Gerald E. Aardsma, "A General Theory of Aging: Part III," The Biblical Chronologist 10.5 (March 31, 2020): page 1. www.BiblicalChronologist.org.
^ It is difficult to estimate the start of Phase II accurately because the onset of deaths due to Aging 2 is gradual. For the modern fitted aging curve, it appears that Aging 2 is responsible for about 1 death per 10,000 living 10-year-old males.
^ Gerald E. Aardsma, Addendum to Aging: Cause and Cure (Loda, IL: Aardsma Research and Publishing, July 26, 2019), pages 10–12. www.BiblicalChronologist.org.
^ Gerald E. Aardsma, "A General Theory of Aging: Part I," The Biblical Chronologist 10.2 (February 12, 2020): page 2. www.BiblicalChronologist.org.
^ Moretton A, Morel F, Macao B, et al. "Selective mitochondrial DNA degradation following double-strand breaks," PLoS One 12(4) (2017): e0176795. Published 2017 April 28. doi:10.1371/journal.pone.0176795 (Accessed 2020/05/09 via ncbi.nlm.nih.gov/pmc/articles/PMC5409072/.)
^ R. H. Hämäläinen, J. C. Landoni, K. J. Ahlqvist, et al. "Defects in mtDNA replication challenge nuclear genome stability through nucleotide depletion and provide a unifying mechanism for mouse progerias," Nature Metabolism 1.10 (1 October 2019): pages 958-965.
^ Gerald E. Aardsma, Aging: Cause and Cure (Loda, IL: Aardsma Research and Publishing, 2017), pages 103–106. www.BiblicalChronologist.org.
^ Genesis 7:6.