
| |
| Volume 10, Number 15 | October 28, 2020 |
Human aging is a three-headed dragon.
The first head is named "Aging 0," the second head "Aging 1," and the third "Aging 2." These three heads are not triplets. They are each unique.
At our birth, our personal aging dragon, residing deep within our physical body, was embryonic and undeveloped. It would have remained indefinitely embryonic and unable to do us any harm if two closely related, recently discovered vitamins, methylphosphonic acid (MePA)[1] and methylphosphinic acid (MePiA)[2], had been present in adequate amounts in our diets. But because these two vitamins are no longer naturally available in any food or drink, our personal aging dragon began to develop. Early on, it sprouted two heads: Aging 0 and Aging 1. Aging 1 fed insidiously on our living flesh until, after some years, the dragon had grown sufficiently to sprout its third head, Aging 2. Aging 2 soon outstripped the other two heads, greedily gobbling away at us. If the dragon continues to have its way, once it has grown large enough, it will devour us completely, killing us in the process.
The existence of these dragons has been known from very ancient times by the havoc they wreak on our bodies. How to vanquish them has been the object of dreams and schemes also from very ancient times. The Biblical Chronologist is the first to know enough about these dragons to wield effective weapons against them. That they may be kept dormant by vitamins MePA and MePiA has only recently been discovered. The discovery that they are three-headed dragons is even more recent.[3]
The discovery that these dragons are kept perpetually dormant by adequate daily intake of vitamins MePA and MePiA constitutes the fundamental cure for human aging. This discovery means that the human aging syndrome may be eliminated from Earth in a single generation by the simple expedient of universal lifelong dietary supplementation of vitamins MePA and MePiA in adequate daily amounts.
This expedient should, of course, be seized upon at the highest levels of government, and it should, of course, be promptly implemented. Aging is, after all, humanity's number 1 health pandemic, flourishing virtually unimpeded from very ancient times. Compared to it, COVID-19 is a Sunday school picnic. American deaths involving COVID-19 in 2020 exceeded 1,000 per day for less than three months and peaked at 2,400 per day.[4] Meanwhile, aging claims well over 6,000 American lives per day, each and every day, year after year.[5]
But do not hold your breath waiting on appropriate government action. The Biblical Chronologist is decades ahead of mainstream culture in its understanding of biblical history and, because of its unique utilization of ancient biblical life span data, The Biblical Chronologist is decades ahead of mainstream science in its understanding of aging. Widespread cultural ignorance, anti-Bible prejudice, plus normal bureaucratic inertia pose high hurdles to appropriate government action in this particular instance.
At present, we must look after ourselves in regard to our own personal aging dragon, and then we must do what we can to help others around us look after themselves in regard to their dragons. The Biblical Chronologist, through Aardsma Research & Publishing (ARP), its parent company, has made a dietary supplement containing these two anti-aging vitamins available to make self-help possible.[6] The supplement is called "Dr. Aardsma's Anti-Aging Vitamins." We are doing what we can do now, from our end, to begin to fight these dragons, while we wait on government and the rest of the world to come up to speed.
Meanwhile, research into human aging, informed by both ancient biblical and modern American life span data, carries on apace at ARP. My purpose with the present BC newsletter issue is to communicate a number of important discoveries resulting from a modeling study, carried out over the past several months, utilizing 2016 actuarial life table data for the U.S. population. Most importantly and urgently, I want to communicate the discovery that mortality due to dietary deficiency of vitamin MePA (i.e., due to Aging 0) appears clearly evident in this modern actuarial dataset, emphasizing the need for all members of the population, of all ages, to begin immediate, lifelong dietary supplementation with Dr. Aardsma's Anti-Aging Vitamins. The modeling study says that mortality could be immediately reduced 5% for U.S. males and 15% for U.S. females were universal lifelong supplementation with Dr. Aardsma's Anti-Aging Vitamins to commence today. Said another way, the model predicts that some 74,000 U.S. male deaths and 212,000 U.S. female deaths could be prevented in 2021 were universal lifelong supplementation with Dr. Aardsma's Anti-Aging Vitamins to begin today.
Over the past several decades, ancient biblical life span data have been used first to instigate and then to refine a new theory of human aging.[7] The most fundamental postulate of this new theory is that human aging is a vitamin deficiency disease.[8] Initially, it was assumed that aging was the singular disease of a single vitamin, the way scurvy is the singular disease of vitamin C deficiency.[9] Subsequently, it became clear that there are two, previously unknown, closely-related anti-aging vitamins involved: 1) vitamin MePA, and 2) vitamin MePiA.[10] At present, it is clear that modern human aging is a syndrome of three aging diseases:[11]
Aging 0: congenital MePA deficiency disease,
Aging 1: congenital MePiA deficiency disease, and
Aging 2: a mitochondrial disease induced by Aging 1 probably subsequent to age 10.
The theory, in this form, is called the theory of two-phase human aging. According to this theory, human aging unfolds in two phases: first a pure vitamin deficiency disease phase (Aging 0 and Aging 1) and then a second phase during which all three aging diseases are operating simultaneously.
To the present time, development of this theory has relied heavily on ancient human life span data. The task this issue is to determine whether the two-phase theory is able to explain modern human life span data.
The question is not whether the two-phase theory can explain the dramatic shortness of modern human life spans relative to ancient biblical life spans. It does that at the outset. Remove a vitamin from a person's diet and you can be sure that person will die young. The more vitamins you remove, the younger that person will die. We modern humans are dying tragically young relative to our ancestors, who enjoyed youthful life spans of nearly 1,000 years, because vitamins MePA and MePiA are missing from modern diets. The question this issue is whether the two-phase theory can account for the detailed pattern of modern shortened life spans; the dramatic shortness of modern human life spans is already amply explained.
Modern human life span data reveal a distinctive pattern.
For each calendar year, or cohort, death rates are relatively high in the first year after birth, decline very rapidly to a low point around age 10, and thereafter rise, in a roughly exponential fashion, before decelerating (or slowing their rate of increase) at the end of the life span.[12]
Is the two-phase theory able to explain this pattern, and not just in a qualitative, hand-waving, approximate sort of way, but in detail and in a precise quantitative fashion? If it cannot do so, then something is yet wrong with the theory, and it needs further development.
The purpose this issue is to advance understanding of the nature of modern human aging by using the theory of two-phase human aging to model modern human life span data.
The data of interest this issue are shown graphically in Figure 1.
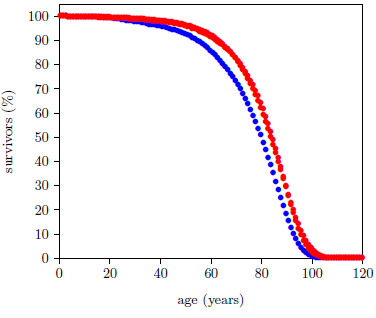 |
This dataset has been introduced previously.[13] It is for the year 2016 from the United States Social Security Administration's actuarial life tables.[14] It is an extraordinary dataset, incorporating death data from 2,744,248 individuals.[15] This large number of individuals results in very small measurement uncertainties in most of the individual data points, allowing small effects to be clearly resolved.
The Aardsma model for generic aging disease provides the needed foundation for explaining this dataset. Recall that this model has been specified previously as:[16]

In the present context, this equation includes two contributions to death of individuals within a total population of N0 individuals all of the same age. The first contribution is due to aging disease, controlled by K and A, and the second contribution is due to a constant background rate of random extraneous (i.e., not due to aging) deaths controlled by R.
Figure 2 shows that the Aardsma model is able to explain the gross features of the pattern of the dataset reasonably well. That is, the fitted curves follow the data points reasonably well. This says that the modern human survival curve is dominated, in panoramic view, by an incidence of death due to aging which increases exponentially with age.
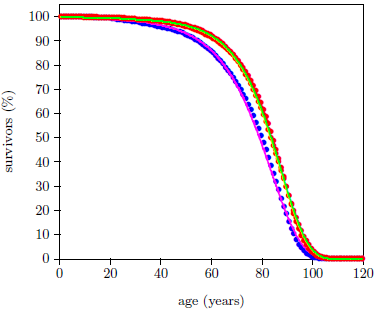 |
This same result has been observed previously.[17] There, I noted that, while the coarse pattern of the dataset is explained by the Aardsma model, the fine details of the dataset are not explained at all. This is most forcefully revealed by the goodness of fit parameter, Χ2ν, for the two curves of Figure 2. For a good fit, this parameter is expected to be less than 1.5. For the fit to the male data it is 17,462, and for the female data it is 8,494.
The fits are as poor as they are because, as has previously been pointed out,[18] actuarial life table data include deaths from many other causes than just aging. The Aardsma model includes an age-independent, random deaths term, but it neglects all age-dependent extraneous causes of death. This is suitable for much laboratory animal data, but it is not suitable for real-life human life span data. While laboratory animals do not kill one another in wars, for example, real-life humans do.
To explain these modern life span data quantitatively, using the Aardsma model, it is necessary either to 1) upgrade the Aardsma model by adding more terms needed to describe additional causes of death, or 2) eliminate these extraneous deaths from the dataset in some way.
In the following analysis, I will be using the second method. Because the analysis is no longer seeking to explain just the broad outline of the dataset—because it is now digging into the details—this is an unavoidably complex undertaking. To keep things as simple as possible, I will proceed in small steps, chipping away at the analysis a piece at a time, to arrive at a final solution through a series of successive approximations.
The Aardsma model, as it is presented in Equation 1, describes aging in a generic way. The two-phase aging theory is not generic. It describes three specific aging diseases—Aging 0, Aging 1, and Aging 2—each of which contributes to aging in its own specific way. All three of these diseases need ultimately to be represented in the model, each by its own individual term patterned on the Aardsma model. As a first step in this direction, include in the model at this stage only the dominant disease of these three.
Aging 2 is believed to be the dominant aging syndrome disease today. It was definitely dominant prior to Noah's Flood.
Though Aging 1 and Aging 2 were both active pre-Flood, Aging 2 was the dominant aging disease back then. The pre-Flood biblical dataset has revealed that Aging 2, induced by Aging 1, was by far the primary cause of aging deaths pre-Flood.[19]
Aging 0 (i.e., MePA deficiency disease) would not have been a part of human aging back at that time because, whenever MePiA is being naturally manufactured via atmospheric chemistry, as it was before Noah's Flood,[20] MePA, resulting naturally from oxidation of MePiA, persists and accumulates in the environment. This implies that MePA would have been abundant in natural sources of drinking water back before the Flood.
At present, because there is no appreciable amount of MePiA being manufactured in the atmosphere, there is also no appreciable amount of MePA. So nobody is getting MePA from any natural source today, making it hypothetically possible for Aging 0 to be the dominant cause of aging deaths today.
Life span data from laboratory mice argue against this possibility. Mice treated with MePA failed to show a measurable increase in longevity while mice treated with MePiA showed a clear increase in longevity.[21] Treatment with MePA cures Aging 0. Thus, the experimental data with MePA showed that mice cured of Aging 0 did not exhibit measurable life lengthening. This implied that these mice were predominantly dying of some aging disease other than Aging 0. Thus, Aging 2 appears to be the dominant aging disease at present, just as it was in the past. As a first step in modeling the modern actuarial life table data, generic aging should be replaced by Aging 2 disease.
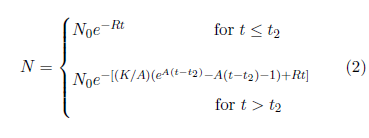
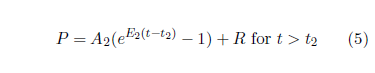
The generic aging model of Equation 1 is not far from what is needed to describe Aging 2 deaths. Deaths due to Aging 2 are expected to increase exponentially with age, as Equation 1 describes. The only real difference is that Aging 2 does not begin at birth (i.e., at t=0). Aging 2 is induced by Aging 1. Aging 1 must operate for some length of time before Aging 2 is induced, so Aging 2 cannot begin at birth. It is still correct to have random deaths beginning at birth, as they do in Equation 1, but the onset of Aging 2 deaths needs to be delayed for some length of time. To make this happen, Equation 1 needs to be modified (generalized) by introduction of a fourth parameter, t2, specifying the time at which Aging 2 begins. This necessary modification yields the first-approximation model shown in Equation 2.
The next objective is to fit this first-approximation model to the 2016 actuarial dataset to see how well it does at this level of approximation. To keep things as simple as possible, focus on just the male dataset for now.
It is clear that this simple model will not do well if fit to the entire male dataset because of the presence of extraneous (i.e., not due to aging) deaths, as mentioned above. To make progress toward the present objective, a method of eliminating extraneous deaths from the dataset must be devised.
The Aardsma model already accounts for age-independent extraneous deaths. This is what the R is all about in Equations 1 and 2. These are deaths that can happen to anybody at any age with equal probability. Being struck by a meteorite is a good, if rare, example of an age-independent extraneous death.
Missing from the Aardsma model are age-dependent extraneous deaths. Neonatal deaths are a good, and, sadly, not so rare, example in this category. The 2016 U.S. actuarial life table for males reveals, for a starting population of one million males, 6,364 deaths in the first year of life and only 429 deaths in the second year of life. Clearly, the first year contains a very large, age-dependent, neonatal contribution which is in no way due to Aging 2.
The most obvious way of eliminating neonatal deaths from the dataset is by the simple expedient of excluding the data point for the first year of life from the least squares fit of the first-approximation model to the dataset.
Further pondering of the problem of age-dependent extraneous deaths soon clarifies that this method of removing neonatal deaths can be extended to other age-dependent extraneous deaths. Data points which are clearly too "contaminated" by age-dependent extraneous deaths can simply be excluded from the fit. This will allow aging deaths to have primary influence over the fit. Of course, this approximation will fail if too many data points are so contaminated that they have to be excluded, but this outcome seems unlikely. The dataset has over 110 data points. A model including all three aging diseases would be expected to have fewer than a dozen free parameters. Well over half of the data points could be excluded, and still there would be a large number of degrees of freedom remaining for the least squares fit.
Up to the present time, the Aardsma model has been used to model survival curves constructed from total-survivors-versus-time data. It is much easier and more intuitive to use this data-exclusion method with probability-of-death-per-unit-time data points than it is with total-survivors-versus-time data points, so the next task is to transform the problem into its probability form.
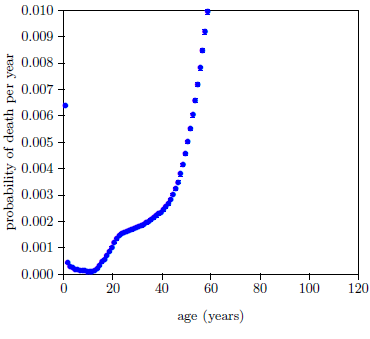
The actuarial life table data are conveniently given in both forms. Figure 3 shows the 2016 actuarial life table dataset for U.S. males in probability-of-death-per-year form.
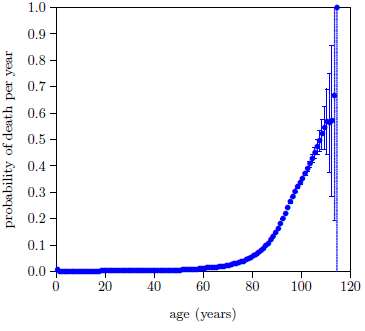 |
The probability of death per year, P, is seen to be quite small for the first four or five decades of life, but by 80 years the probability of death per year is well above zero and bending sharply upward.
The error bars are calculated as the square root of the actual number of deaths per year divided by the number of survivors at the beginning of the year (measured from the annual birthday of the individual), starting from the actual total number of U.S. males who died in 2016. The published actuarial table specifies deaths per year from a starting population of 100,000 individuals, not the actual number of U.S. males who died in 2016. The actual number of deaths in the United States for 2016 reported by the CDC was 2,744,248.[22] Taking half of these to be male yields an actual starting population of 1,372,124. Thus, to get the error bars right, the actual number of deaths per year was calculated from the published table using this starting population size rather than 100,000.
The calculated error bars are too small to be seen in Figure 3 for most of the data points, but they become quite large as age increases beyond 100 years. These large error bars result from the relatively small numbers of survivors beyond 100 years today.
Now the Aardsma model needs to be transformed from its survival form to its probability form.
The defining differential equation for the Aardsma model has been previously specified as:[23]

This can be transformed to probability of death per unit time by dividing both sides of the equation by -N.

The left side of the equation is now the probability of death per unit time. Call this simply P from now on. In practice, P is just the number of deaths in a given time interval divided by the number of survivors at the beginning of the time interval and divided by the length of the time interval. For the 2016 actuarial life table for males, P for the first year of life is just (6364 / 1,000,000 / 1 =) 0.006364, and for the second year of life it is (429 / (1,000,000 - 6364) / 1 =) 0.000432.
It is helpful, at this stage, for clarity and mnemonic value, to make a slight change of notation. The present context is concerned with the application of this model specifically to Aging 2. This has already instigated generalization of this equation by the introduction of t2 as a fourth parameter. Following the lead of this subscripted notation, replace A in Equation 4 with E2 and replace K with A2. The result of these changes is:
Just as R controls random extraneous deaths, so A2 controls Aging 2 deaths. Meanwhile, E2 is an exponential growth constant, controlling how rapidly the probability of death due to Aging 2 increases with age.
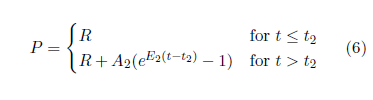
The transformed generalized Aardsma model may now be specified from birth onward as:
The next task is to select the data points to be included in the least squares fit. The goal is to minimize the impact of age-dependent extraneous deaths on the fit.
Each data point gives a probability of death for a given age. The probability of death for a given age is the sum of the probabilities of death for numerous causes of death at that age. Potential causes of death include both Aging 2 and extraneous deaths such as murder and automobile accident. All of the data points are contaminated with extraneous deaths to some extent, but some points are much more contaminated than others. Extraneous deaths become less and less noticeable as age increases. In the first four or five decades of life, Aging 2 is not very developed, so most deaths are due to extraneous causes. But this reverses in the latter decades of life. Development of Aging 2 is then advanced, causing most deaths to be due to Aging 2 disease, and causing extraneous deaths to become relatively minor.
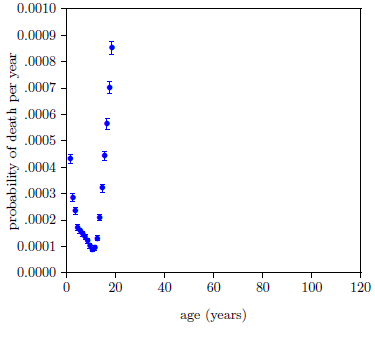
Figure 4 allows the typical magnitude of extraneous deaths to be estimated.
 |
It shows the 2016 actuarial life table dataset for U.S. males with the probability axis expanded by a factor of one hundred. The data have gone off scale by age 60. Aging 2 is significantly developed by age 60, so data points up near age 60 aren't very helpful for the present purpose because they mix together both significant Aging 2 deaths and significant extraneous deaths. But below about age 40, Aging 2 is not very developed, so these ages provide a good estimate of the typical size of the probability of death due to extraneous causes. This suggests that extraneous deaths can be expected to account for a probability of death per year of say less than about 0.0025.
This means that data points having a total probability of death per year greater than 0.025 can be expected to be contaminated at less than a (0.0025/0.025×100 =) 10% level, data points having a probability of death per year greater than 0.05 can be expected to be contaminated at less than a 5% level and data points having a probability of death per year greater than 0.25 can be expected to be contaminated at less than a 1% level.
For the 2016 dataset for males, the 10% (0.025) level corresponds to age 71, the 5% (0.05) level corresponds to age 79, and the 1% (0.25) level corresponds to age 95. Adopt the 5% level as the cutoff at this stage. That is, keep all data points from age 79 on.
Next, the fit needs some data points in the low age range. Figure 5 provides visual assistance with this.
 |
It shows the 2016 actuarial life table dataset for U.S. males with the probability axis expanded by a factor of one thousand. Extraneous deaths fall off fairly rapidly from both sides to a minimum between 10 and 11 years of age. This minimum—below 1 death per 10,000 individuals per year—seems likely to be mainly due to random extraneous deaths, which are included in the model by the R parameter. So points near this minimum should not introduce any large error into the fit.
Keep the three points closest to this minimum. That is, keep the ages 9, 10, and 11 data points.
These choices retain 39 data points at this stage: the 36 data points from age 79.5 (i.e., for the time interval from 79 to 80 years of age) to the end of the dataset, plus the three data points displaying the lowest P values of the entire dataset, from ages 9.5, 10.5, and 11.5 inclusive.
If the Equation 6 model is fit to the selected data points at this stage, the least squares fitting program finds for the age at which Aging 2 begins, t2 = 8.0 ± 64.7 years. The very large relative error found for this parameter results from the fact that few data points have been able to be retained in the fit down at the young ages where the true value of t2 is expected to be found. The least squares fit mathematics is saying that it doesn't have enough input data points where they are needed to be able to nail this parameter down at this stage. This seems likely to add a lot of variability to subsequent fits as the model is developed below, obscuring the effects of further improvements, so it seems best to deal wth this at this stage.
The problem can be worked around by estimating t2 independently, and then using the estimate as a fixed parameter rather than a free parameter of the model at this stage.
Begin by fitting the Equation 2 model to the biblical dataset for pre-Flood human males to determine the value of t2 pre-Flood. This method of finding a value for t2 works in this instance because the pre-Flood dataset has been selected for long-lived males, effectively eliminating causes of death other than Aging 2. Then rescale the pre-Flood value to give an estimate of t2 today.
The dataset for pre-Flood human males has been discussed previously.[24] Recall that it is for a population of individuals who were born at different times spanning hundreds of years. To treat these individuals as a same-age cohort, suitable to the Equation 2 model, entails the assumption that environmental concentrations of the anti-aging vitamins were constant back before the Flood when the seven members of this dataset all lived. While it seems unlikely that this assumption is strictly true, it nonetheless seems likely that the degree of deviation from strict truth is small enough not to invalidate the present estimate of t2.
Figure 6 shows the result of a least-squares fit of the Equation 2 model to this dataset. The parameter of interest, t2, was found to be 800 ± 1 years in this case.
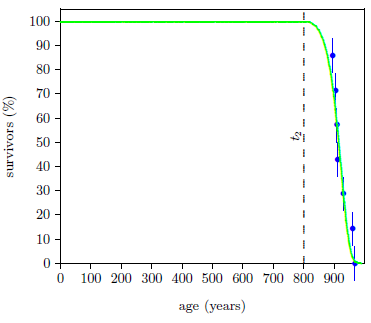 |
Note, in passing, that this says that, before Noah's Flood, humans were free of Aging 2 for the first 800 years of their lives—that they retained youthful adult bodies until their ninth century of life.
The present interest is in the modern case. Before the Flood, the anti-aging vitamins, MePA and MePiA, were relatively abundant. Today they are lacking. Given this pre-Flood estimate for the start of Aging 2, at what age might Aging 2 be expected to set in today?
Simple linear scaling can be used to transform this pre-Flood estimate into a modern estimate. The pre-Flood fit gives 50% survivors at 915.7 years of age. Thus, for the pre-Flood dataset, Aging 2 began (916 - 800 =) 116 years prior to the 50% survival age. The dispersion in the modern data is less than in the pre-Flood data, as discussed previously.[25] The full width at half maximum of the death rate distribution for the modern dataset was found to be 28 years while for the ancient dataset it was found to be 49 years. Thus, Aging 2 may be estimated to begin (116 × 28 / 49 =) 66 years prior to the 50% survival age for modern males. Actuarial life table data for U.S. males in 2016 gives 50% survivors at 80.2 years.[26] Hence, this method of estimating the age for onset of Aging 2 for modern males yields (80 - 66 =) 14 years.
Treat t2 as a fixed parameter having a value of 14 years from this point on.
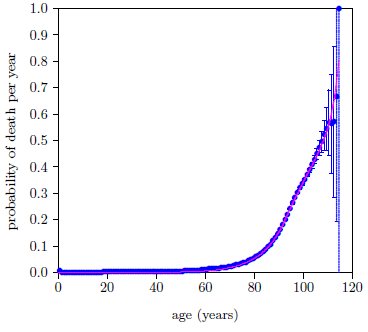
Figure 7 shows the fit of Equation 6, with t2 = 14 years, to the selected data points.
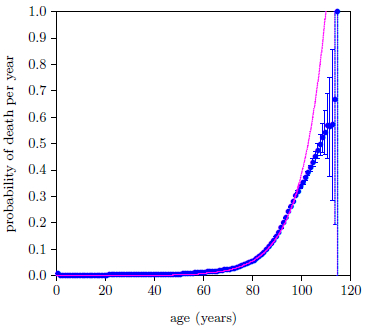 |
This gave Χ2ν = 54.7 with 36 degrees of freedom—still a long way from 1.5, signaling a surprisingly poor fit.
The reason for the poor fit is visually apparent from the graph. The data deviate from the expected exponential growth, shown by the magenta line, beginning somewhere after age 90.
The most obvious question to ask in such a case is whether the data can be trusted. This unexpected slowing of the rate of increase of P happens in the nineties, and not a lot of people make it to their nineties. Is it possible that the slowing is just a statistical anomaly with this particular dataset?
No it is not possible. We are assured by the quotation from the Social Secuity Administration given previously that, for the general case, the "death rates… rise, in a roughly exponential fashion, before decelerating (or slowing their rate of increase) at the end of the life span."[27] This plainly says that the slowing down is always seen in all datasets. The problem is clearly with the model, not with the data. (I always love it when this happens because it means that I am about to learn something new about God's fascinating creation.)
These data are insisting that Aging 2 does not continue to progress exponentially indefinitely as the Aardsma model assumes. Even though Aging 2 still continues to progress past age 90, its rate of progression slows down.
This is a significant discovery. It means that the development of Aging 2 disease is subject to one or more limiting factors—that progression of Aging 2 disease saturates (i.e., slows down and eventually ceases).
I am only at the beginning of my quest to understand the nature of Aging 2 disease, so my ignorance of this disease vastly outweighs my knowledge of it at present. But in science, as elsewhere in life, one must start somewhere, so let me venture a first, tentative working hypothesis to explain this discovery. Aging 2 is a disease of the mitochondria. The primary role of mitochondria is energy production for the cell. Cells can produce energy not only via their mitochondria but also via glycolysis. While the role of glycolysis varies by cell type, in general, mitochondria carry most of the load of energy production for the cell, with the contribution from glycolysis being minor. But the existence of these two different energy sources means that cellular energy will not drop to zero as, due to exponentially increasing mitochondrial dysfunction, mitochondrial energy production drops to zero. Rather, cellular energy will drop no lower than the amount provided by glycolysis. Thus, the rate of increase of cellular dysfunction and death due to energy starvation, leading ultimately to whole organism dysfunction and death, will approach a constant saturation level even though mitochondrial dysfunction continues to progress exponentially.
The model is now in need of an alteration. The description of death due to Aging 2 needs to be improved to allow for saturation.
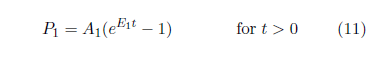
Briefly, let ts be the time at which exponential progression of Aging 2 stops and saturation begins. Use the functional form (1-e-x) to describe saturation.[28] Demand that the resulting curve and the slope of the curve be continuous at ts. This yields:
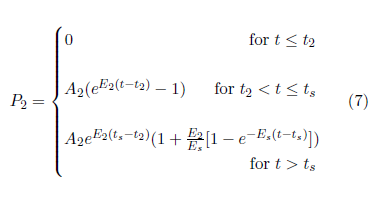
The model is now:

The fit of the Equation 8 model to the selected data points is shown in Figure 8. This is now a five parameter fit (R, A2, E2, Es, and ts) with t2 fixed at 14 years. The fit is remarkably improved. The value of the goodness of fit parameter, Χ2ν, reflects this. It has now dropped below 1.5 for the first time, to just 0.43 with 34 degrees of freedom.
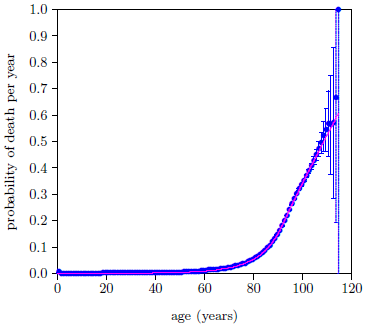 |
But, even though the fit is now statistically good for the first time, the data are still saying that something is not quite right with the model. The final 10 data points are all visibly above the magenta line. The female dataset (not shown) behaves in a similar way at this stage. The data are saying that there is another cause of death which the model is, so far, not accounting for. This cause must be an aging disease because the extraneous death contribution to these high age data points has dropped well below the 1% level. Recall that the 1% cutoff is back at age 95.
It is good news for the two-phase theory that the data are saying this. It means that the data are independently saying the same thing the two-phase theory is saying, that aging, as it is experienced today, is made up of more than just a single aging disease. This, of course, is independent corroboration of the theory of two-phase human aging.
The two-phase theory has two more aging diseases ready to go: Aging 0 and Aging 1. Which of these two is the next most dominant disease? Real-life observation argues in favor of Aging 0.
I had the fortunate misfortune, several years ago, of having vitamin MePA be my first anti-aging vitamin discovery and mistakenly thinking it was the only anti-aging vitamin. This resulted in a significant number of individuals, myself included, taking vitamin MePA by itself for some months or years. The results of this unintended, single-vitamin experiment was that many health improvements resulted for many individuals, revealing the importance of this vitamin to health.[29] In my own case, the results were somewhat dramatic, as I have recounted elsewhere.[30] I have since, on several occasions, commented in private conversation that I felt that I would likely be dead were it not for vitamin MePA. My health before vitamin MePA was trending steadily downward. I was having to exercise more and more personal discipline with food and work habits to stay healthy enough to be productive, yet I felt that I was fighting a slowly losing battle. This all reversed with the advent of MePA.
Vitamin MePA is the cure for Aging 0. Said simply, my personal experience implies that Aging 0 can be debilitating ultimately to the point of death. And this says that Aging 0 should be a real—not just a hypothetical—part of modern actuarial life table data. It appears that, while Aging 2 is the most dominant cause of death, Aging 0 should be next in line and not too far behind.
The Aging 0 term is a relatively easy adaptation of the Aardsma model. It is simply an exponential increase in the probability of death per year starting from birth from an initial zero probability of death. Using subscript 0 to designate Aging 0 parameters, the needed term looks like this:

This upgrades the model to:

Figure 9 shows the result. This is now a seven parameter fit (R, A0, E0, A2, E2, Es, and ts) with t2 still fixed at 14 years.
 |
Though the visual fit is much better in the final decade, Χ2ν has improved only slightly, from 0.43 to 0.42 (now with 32 degrees of freedom), because of the large error bars diminishing the weights of the data points in this region.
It might seem that development of the model could stop at this point. The data's demand for a second disease has been satisfied, with a good fit both statistically and visually the result. But there is yet a problem. The model's placement of the second disease, Aging 0, does not agree with real-life, personal experience of this disease.
Figure 10 shows the problem graphically.
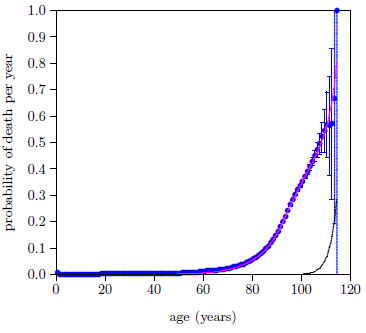 |
It shows, as a black line, the contribution to the total probability of death the model has assigned to Aging 0. That is, the magenta line shows the total probability of death, made up of all causes of death, while the black line shows just the putative Aging 0 contribution to the total probability of death.
The black line makes negligible contribution to deaths until very late in life, out near 100 years of age. My personal encounter with Aging 0 started when I turned 50, with the onset of chronic inflammatory demyelinating polyneuropathy (CIDP), and intensified throughout the succeeding decade until it seemed unlikely that I would last yet another decade. This same conflict with reality exists for nearly all of the individuals who supplemented with vitamin MePA alone and experienced resulting health benefits, nearly all of whom were decades younger than 100 years.
It appears that, while a two-disease model is able to fit the dataset mathematically, the resulting solution does not correspond to the real world.
The two-phase theory specifies three aging diseases, not two. Is there possibly a three-disease model which both fits the data mathematically and more accurately reflects real-life experience?
Aging 1 is MePiA deficiency disease. MePiA is an antioxidant. The working hypothesis for vitamin MePiA at present is that MePiA fulfills a unique antioxidant function within the mitochondria, protecting mitochondrial DNA (mtDNA) from excessive free radical damage. Loss of this vitamin from the diet results in loss of protection of mtDNA, with consequent, eventual induction of Aging 2, which is fundamentally a mitochondrial disease.
It seems unlikely that the role of Aging 1 in human aging stops with just induction of Aging 2. Free radical production in living tissue never ceases and, in the absence of MePiA, free radical damage of mtDNA carries on unabated with or without induction of Aging 2. This damage seems certain to have deleterious effects beyond just induction of Aging 2.
Meanwhile, the traditional vitamins teach us that individual vitamins tend to fill multiple biochemical roles. It seems likely, by analogy, that this is true also of MePiA. If this is the case, then the probability that lifelong MePiA deficiency will have no actuarial life table consequences diminishes yet further. Clearly, Aging 1 should be included in the model.
Aging 1 is modeled similar to Aging 0, using subscript 1 to identify Aging 1 parameters:
Inclusion of this third aging disease upgrades the model to:

Note that the mathematical forms of the Aging 0 and Aging 1 terms, P0 and P1, are identical. This poses potential trouble for the least squares fit. It is possible for the least squares search algorithm to find two-disease solutions by setting either A0 or A1 effectively to zero, or by setting A0 = A1 and E0 = E1. Fortunately, these two-disease solutions, which are not of interest in the present context, can be avoided by choosing starting values for the free parameters judiciously.
Figure 11 shows the final weighted least squares fits of the two-phase, three-disease model to the 2016 actuarial life table datasets for U.S. males (blue) and females (red). This figure makes it immediately clear that all three aging diseases are indeed present in the actuarial life table datasets and that the previous, two-disease model had mistakenly found Aging 1 as the second aging disease rather than Aging 0.
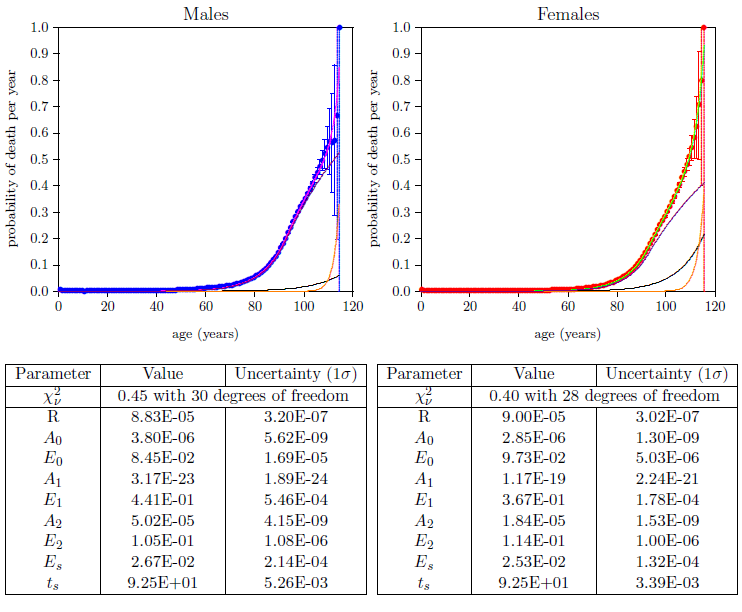 |
Because Aging 0 and Aging 1 share the same mathematical form, it is in principle possible for a two-disease model to find either of these two as the second aging disease. This means that, with the right starting values, it should be possible for the two-disease model to find Aging 0 as the second disease, rather than Aging 1. In that case, it seems likely that the visual fit to the centenarian actuarial life table data would not be much improved, suggesting that a third aging disease was yet missing.
All things considered, the actuarial life table data appear clearly to solicit a three-disease model.
The fit of the proper, three-disease model to the male and female datasets (Figure 11) immediately informs us that Aging 1 is indeed the least dominant of the three aging diseases—it shows up last and plays little direct role in aging deaths prior to 100 years of age. It, of course, plays a severe, indirect role in aging deaths by its induction of Aging 2 disease during childhood. Meanwhile, in stark contrast to its earlier quiescence, it quickly becomes a significant player in centenarian mortality for both males and females. The implication of this discovery is obvious. Aging 1 is MePiA deficiency disease. MePiA deficiency disease can be quickly cured by supplementing one's diet with an adequate daily amount of vitamin MePiA. The three-disease model shows that centenarians are especially sensitive to this deficiency disease. Centenarians, therefore, need to be especially careful to be supplementing their diets with the recommended daily intake of vitamin MePiA.[31] According to the model, centenarians following this advice significantly improve their chances of breaking current longevity records.
The proper, three-disease model now brings Aging 0 into harmony with real-life experience. Aging 0 now rises above the level of random extraneous deaths at about age 40 and continues to increase exponentially from there. It accounts for about 11% of aging deaths in males and 25% in females at age 50, for example.
While mortality due to MePA deficiency disease (i.e., Aging 0) is very low prior to age 40, this does not mean that vitamin MePA is not needed prior to age 40. The actuarial life table data show only mortality, not morbidity. Optimal health at all ages is dependent on a proper daily intake of all of the vitamins. When a vitamin is deficient in the body, biochemical pathways become inaccessible and cells are unable to manufacture biomolecules needed for growth and maintenance. This weakens every cell in the body. Early in life, most members of a same-age population will be healthy enough to survive despite the presence of vitamin MePA deficiency disease, but a few, suffering from other serious ailments, will not. In addition, ability to survive life-threatening events such as fires or automobile accidents will be diminished by the whole-body weakening resulting from the presence of vitamin MePA deficiency disease. In consequence, the probability of death due to Aging 0, while tiny prior to age 40, is still real and measurable even in the early childhood years. Thus the model illustrates that lifetime, daily supplementation with the anti-aging vitamins, MePiA and MePA, is the only path to optimal health and longevity.
Figure 11 shows a clear disparity between males and females in relative sensitivity to Aging 0 (black lines). The model says that women are more sensitive to vitamin MePA deficiency disease than are men. This provides further evidence of the validity of the theory of two-phase human aging. Aging 0 is vitamin MePA deficiency disease, and vitamin MePA deficiency disease seems to engender auto-immune diseases.[32] In my case, I got CIDP. CIDP is an autoimmune disease in which the body attacks its own nerve cells. After suffering from this autoimmune disease for eleven years, I began to experience an eventual complete cure three and a half weeks after beginning to supplement my diet with MePA. MePA appears to act against autoimmune diseases, and women are far more susceptible to autoimmune diseases than are men.[33]
Autoimmune diseases are the third most common category of disease in the United States after cancer and cardiovascular disease, affecting ∼5 to 8% of the population or 14.7 to 23.5 million people. Conservative estimates indicate that ∼78% of the people affected with autoimmune diseases are women.The model's finding, that women are more sensitive to Aging 0 than are men, is clearly supported.
On the flip side, the model says (Figure 11) that men are more sensitive to Aging 2 (violet lines) than are women. This further corroborates the theory of two-phase human aging. Specifically, the two leading causes of death in the U.S. are heart disease and cancer. The model makes it clear that Aging 2 is, by far, the leading cause of all deaths. This immediately implies that heart disease and cancer are symptoms of the more fundamental disease Aging 2. (Note, in passing, that this, in turn, implicates mitochondrial dysfunction as the root cause of both heart disease and cancer.) Since, according to the model, men are more sensitive to Aging 2 than are women, an immediate prediction of the model is that the age specific incidence of both heart attack and cancer will be higher in men than in women. This is found to be true in both cases.[34]
Perhaps the most blatant observation from Figure 11 is that Aging 2 deaths dominate human aging at present, far outstripping all other causes of death combined. Table 1 quantifies this.
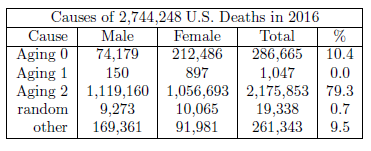 |
Roughly 4 out of 5 deaths are due to Aging 2. Yet again the implication is clear. While a method of preventing Aging 2 is known, a means of curing Aging 2 needs to be elucidated as rapidly as possible. This is currently the highest priority research focus of The Biblical Chronologist.
The two-phase, three-disease model (Figure 11 and Table 1) makes it clear that Aging 0 is responsible for many, many deaths at present. Table 1 ascribes to Aging 0 a total of 286,665 U.S. deaths in 2016. This says that more than one in ten U.S. deaths in 2016 was due to Aging 0. Of course, there is nothing particularly special about 2016. This same loss of life happens each year. The tragedy is that it is now totally unnecessary.
Once again, the implication is clear. Aging 0 is vitamin MePA deficiency disease. Just as scurvy can be cured in short order by adequate daily intake of vitamin C, so Aging 0 can be cured in short order by adequate daily intake of vitamin MePA. Dr. Aardsma's Anti-Aging Vitamins dietary supplement is able to eradicate Aging 0, just as vitamin C has eradicated scurvy and just as vitamin B3 (niacin) has eradicated pellagra and just as vitamin B1 (thiamin) has eradicated beriberi, etc., and the model says that when this happens, over a quarter million U.S. lives, of all ages and both sexes, will be saved per year.
The theory of two-phase human aging has been shown to provide a quantitative explanation of the pattern of modern human actuarial life table data. To the best of my knowledge, this is the first time the detailed pattern of human actuarial life table data has been scientifically and mathematically explained by any theory of aging.
It was found that a good fit of the dataset could not be obtained with a single exponential (i.e., a single-aging-disease) model. To get a statistically and visually good fit, two exponentials were required and the dominant exponential had to be capable of saturation. While this arrangement was capable of yielding a good fit statistically and visually, the resulting solution did not accord with reality. To obtain a true-to-life solution while retaining a good fit statistically, a third exponential had to be added. Thus it was found that the dataset demands more than a single-aging-disease model and solicits a three-aging-disease model. In this way, the modern dataset corroborates the theory of two-phase human aging, which theory predicts the simultaneous presence of three distinct aging diseases in modern actuarial data.
The process of fitting the theory of two-phase human aging to the 2016 actuarial life table datasets for males and females has generated a wealth of new insights into modern human aging. Most importantly, it has uncovered the possibility of immediately saving over a quarter million U.S. lives per year, currently perishing unwittingly due to easily treatable vitamin MePA deficiency disease. To protect the population from this disease and, ultimately, to eradicate aging, a policy of universal, lifelong, daily supplementation of diets with vitamins MePA and MePiA should be implemented immediately. The alternative yields only massive, ongoing, unnecessary human suffering and death. ◇
The Biblical Chronologist is written and edited by Gerald E. Aardsma, a Ph.D. scientist (nuclear physics) with special background in radioisotopic dating methods such as radiocarbon. The Biblical Chronologist has a fourfold purpose: to encourage, enrich, and strengthen the faith of conservative Christians through instruction in biblical chronology and its many implications, to foster informed, up-to-date, scholarly research in this vital field, to communicate current developments and discoveries stemming from biblical chronology in an easily understood manner, and to advance the growth of knowledge via a proper integration of ancient biblical and modern scientific data and ideas. The Biblical Chronologist (ISSN 1081-762X) is published by: Aardsma Research & Publishing Copyright © 2020 by Aardsma Research & Publishing.
|
^ Gerald E. Aardsma, Aging: Cause and Cure (Loda, IL: Aardsma Research and Publishing, 2017). www.BiblicalChronologist.org.
^ Gerald E. Aardsma, Addendum to Aging: Cause and Cure (Loda, IL: Aardsma Research and Publishing, July 26, 2019). www.BiblicalChronologist.org.
^ Gerald E. Aardsma, "Human Aging is a Two-Phase Disease," The Biblical Chronologist 10.8 (May 13, 2020): 1–10. www.BiblicalChronologist.org.
^ www.cdc.gov/nchs/nvss/vsrr/covid19/index.htm, Table 1 (accessed 2020/09/07).
^ See Table 1 (page 15) this issue.
^ draardsmasvitamins.com/get-the-vitamins/
^ See, for example: Gerald E. Aardsma, "The Cause of Reduced Post-Flood Life Spans – Part I," The Biblical Chronologist 7.2 (March/April 2001): 1–6. www.BiblicalChronologist.org.
^ Gerald E. Aardsma, "The Cause of Reduced Post-Flood Life Spans – Part IV," The Biblical Chronologist 8.1 (January/February 2002): 1–8. www.BiblicalChronologist.org.
^ Gerald E. Aardsma, Aging: Cause and Cure (Loda, IL: Aardsma Research and Publishing, 2017). www.BiblicalChronologist.org.
^ Gerald E. Aardsma, Addendum to Aging: Cause and Cure (Loda, IL: Aardsma Research and Publishing, July 26, 2019). www.BiblicalChronologist.org.
^ Gerald E. Aardsma, "Human Aging is a Two-Phase Disease," The Biblical Chronologist 10.8 (May 13, 2020): 1–10. www.BiblicalChronologist.org.
^ www.ssa.gov/oact/NOTES/as120/LifeTables_Body.html (accessed 2020/09/24.)
^ Gerald E. Aardsma, "Modeling Survival Curves in Light of the General Theory of Aging," The Biblical Chronologist 10.7 (April 24, 2020): 1–7. www.BiblicalChronologist.org.
^ ssa.gov/oact/STATS/table4c6.html (accessed March 2, 2020).
^ cdc.gov/nchs/data/databriefs/db293.pdf, page 4, Figure 4, Notes (accessed October 19, 2020).
^ Gerald E. Aardsma, "Modeling Survival Curves in Light of the General Theory of Aging," The Biblical Chronologist 10.7 (April 24, 2020): page 4, equation 7. www.BiblicalChronologist.org.
^ Gerald E. Aardsma, "Modeling Survival Curves in Light of the General Theory of Aging," The Biblical Chronologist 10.7 (April 24, 2020): 5. www.BiblicalChronologist.org.
^ Gerald E. Aardsma, "A General Theory of Aging: Part II," The Biblical Chronologist 10.3 (March 4, 2020): 2–3. www.BiblicalChronologist.org; Gerald E. Aardsma, "Modeling Survival Curves in Light of the General Theory of Aging," The Biblical Chronologist 10.7 (April 24, 2020): 2. www.BiblicalChronologist.org.
^ Gerald E. Aardsma, "Human Aging is a Two-Phase Disease," The Biblical Chronologist 10.8 (May 13, 2020): 1–10. www.BiblicalChronologist.org.
^ Gerald E. Aardsma, Aging: Cause and Cure (Loda, IL: Aardsma Research and Publishing, 2017): 63–77. www.BiblicalChronologist.org.
^ Gerald E. Aardsma, Addendum to Aging: Cause and Cure (Loda, IL: Aardsma Research and Publishing, July 26, 2019); Gerald E. Aardsma, "ELLM: the Extraordinarily Long-Lived Mouse," The Biblical Chronologist 10.9 (May 19, 2020): 1–7. www.BiblicalChronologist.org.
^ cdc.gov/nchs/data/databriefs/db293.pdf, page 4, Figure 4, Notes (accessed October 19, 2020).
^ Gerald E. Aardsma, "Modeling Survival Curves in Light of the General Theory of Aging," The Biblical Chronologist 10.7 (April 24, 2020): page 4. www.BiblicalChronologist.org.
^ Gerald E. Aardsma, "Human Aging is a Two-Phase Disease," The Biblical Chronologist 10.8 (May 13, 2020): 1–10. www.BiblicalChronologist.org.
^ Gerald E. Aardsma, "Human Aging is a Two-Phase Disease," The Biblical Chronologist 10.8 (May 13, 2020): page 8, Figure 3. www.BiblicalChronologist.org.
^ ssa.gov/oact/STATS/table4c6.html (accessed March 2, 2020).
^ www.ssa.gov/oact/NOTES/as120/LifeTables_Body.html (accessed 2020/09/24.)
^ Too little is known about the biochemistry of Aging 2 to derive the functional form which should be used here, so this is merely a convenient guess as a first approximation. My purpose at this stage is to preserve the exponential growth part of the description of Aging 2 which the model already has, and merely add saturation to it.
^ www.biblicalchronologist.org/products/vitamin_MePA_ testimonials.php
^ Gerald E. Aardsma, Aging: Cause and Cure (Loda, IL: Aardsma Research and Publishing, 2017): 113–118. www.BiblicalChronologist.org.
^ www.biblicalchronologist.org/RDI.php
^ www.biblicalchronologist.org/products/vitamin_MePA_ testimonials_immune_system.php; www.biblicalchronologist .org/products/vitamin_MePA_testimonials_arthritis.php
^ DeLisa Fairweather, Sylvia Frisancho-Kiss, and Noel R. Rose, "Sex Differences in Autoimmune Disease from a Pathological Perspective," The American Journal of Pathology 173.3 (September 2008): 600–609.
^ www.health.harvard.edu/heart-health/the-heart-attack-gender-gap (accessed 2020/10/17.); Kim, Hae-In et al. "Sex Differences in Cancer: Epidemiology, Genetics and Therapy." Biomolecules & Therapeutics 26.4 (July 1, 2018): 335-342.